Monitoring: Events, Usage, and Metrics
Monitoring your infrastructure is critical to ensure the performance of your services. This page is intended to provide an overview of the monitoring capabilities of the EdgeXR platform. It is written for operators responsible for managing cloudlets, pools, clusters, applications, and application instances.
As an operator, having insights into operational events and metrics can help you mitigate issues quickly, thereby, reducing downtime for developers who have applications and cluster instances deployed to your cloudlets. Also, usage information is invaluable when you need to determine whether scaling up resources is necessary to accommodate your users based on their application and deployment needs.
In addition to monitoring operator-specific events and metrics, you can also view developer metrics, usage, and logs as long as they are part of the cloudlet pool. Information types may include application usage, audit logs, the number of devices connected, and more.
Security and Permissions
To access monitoring information, you need to be part of the organization that owns the object being queried. For example, to be able to query information about a given cluster or application instance, or cloudlets, you must be part of the organization that owns the cluster or application.
Account management is out of scope for this document, but an explanation of the roles available within the EdgeXR platform and the security considerations for those roles are available in the Organizations and Users Guide as well as the mcctl Utility Reference guide.
Trace ID
The EdgeXR platform uses distributed tracing. Each discrete action/event within the EdgeXR platform will include a trace-id. When troubleshooting with EdgeXR Support, please include the relevant trace ids to expedite the process.
Monitoring Components
There are three monitoring components provided by the EdgeXR platform in which you can access through a quick menu. In addition to the monitoring dashboard, which will be described later in the guide, these monitoring components all play an important role in ensuring the health and availability of applications and cloudlets, as well as components to detect anomalies that may impact usage or application performance, and can even reveal usage and behavior patterns or trends that may influence you to modify or readjust current rules or conditions to accommodate users and resource needs.
These monitoring components include:
Events and Audit Events
Usage Logs
Metrics
Details are provided below for each of the three monitoring components, including an overview of how to use the monitoring information from both the Edge-Cloud Console and the EdgeXR API. Some examples of the mcctlcommands will be used in this document to demonstrate how to retrieve events, usage, and metric information, but we will not cover their complete usage in detail. If you would like to learn more about these commands, refer to the mcctl Utility Reference guide.
Events and Audit Events
The EdgeXR platform logs events and audit events as they occur. Unlike metrics, which are collected on an ongoing basis on intervals that you define, events include lifecycle milestones such as applications created, clusters deployed, or cloudlets deployed. They are collected as they occur, while audits capture and provide the records of the events. You can only view events and audit events from Organizations that you are part of.
Events and audits events generate logs that you can use to understand the applications, cloudlets, and their usage and any performance issues detected through a trail of events which include what occurred, when, and where. Audit logs may include capturing activities such as logging, creating applications, deleting users, creating policies, etc. You can specify a range within the audit log display by using a range selector (calendar). On the other hand, event logs may include system-generated events that include services like auto-provision policy, auto-scaling, application instance, or HA. You can set up notifications of alerts when certain threshold conditions are met or exceeded. For more on alerts, see the Health Check and Alerts Guide.
Viewing events and audit events are role-based. Therefore, access to the different events and audit events are specific to the role.
Using the EdgeXR API to view events and audit events
There are two event types that we support: type=event and type: audit. To filter and view these types of events, the show or terms command can be used to view and filter the event types. See the example belows.
$ mcctl events show type=audit
$ mcctl events show type=event
$ mcctl events terms type=audit
$ mcctl events terms type=event
$ mcctl events
Usage: mcctl events [flags] [command]

Available Commands:
  show       Show events and audit events
  showold    Show events and audit events (for old events format)
  find       Find events and audit events, results sorted by relevance
  terms      Show aggregated events terms
For more information on these commands and usages, refer to the MCCTL Reference Guide. For this guide, we will be focusing more on using the user interface to view the different event types.
The same events that are presented using the mcctl commands can also be viewed from the Edge-Cloud Console, as described in the next section.
Using the Edge-Cloud Console to view events and audit events
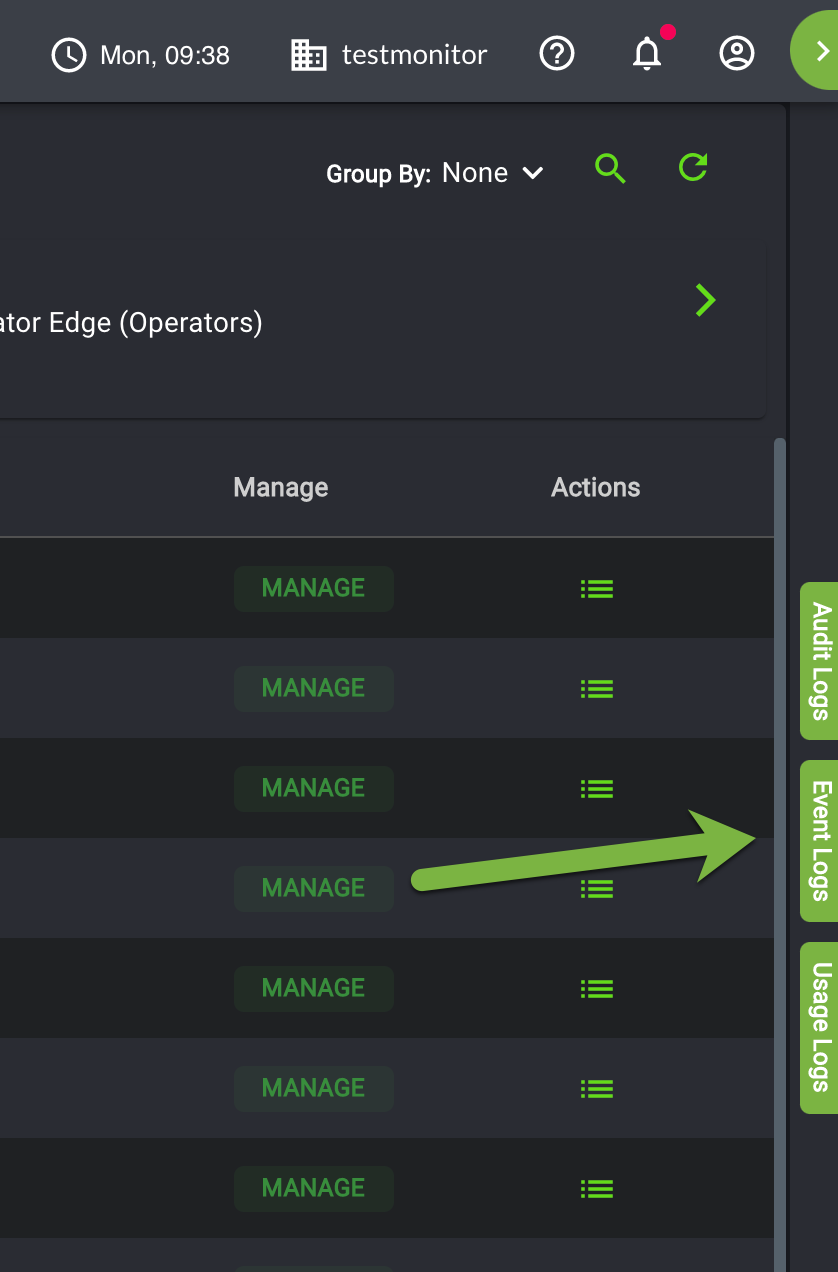
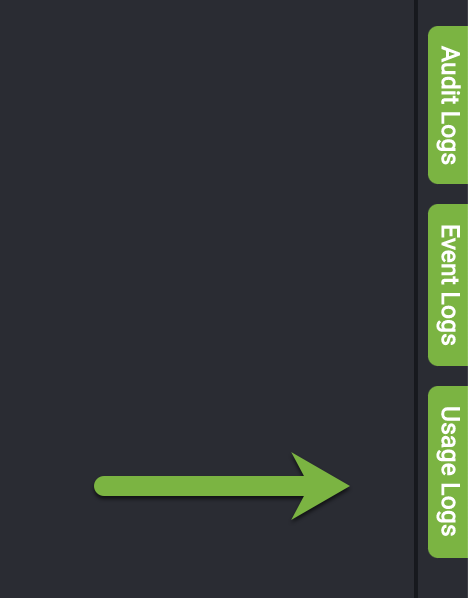
On the right side of the EdgeXR console, there should be three buttons in what is called the Logs Column. The Logs Column contains three icons, Audit Logs, Event Logs, and Usage Logs. Select Events Logs from the menu.
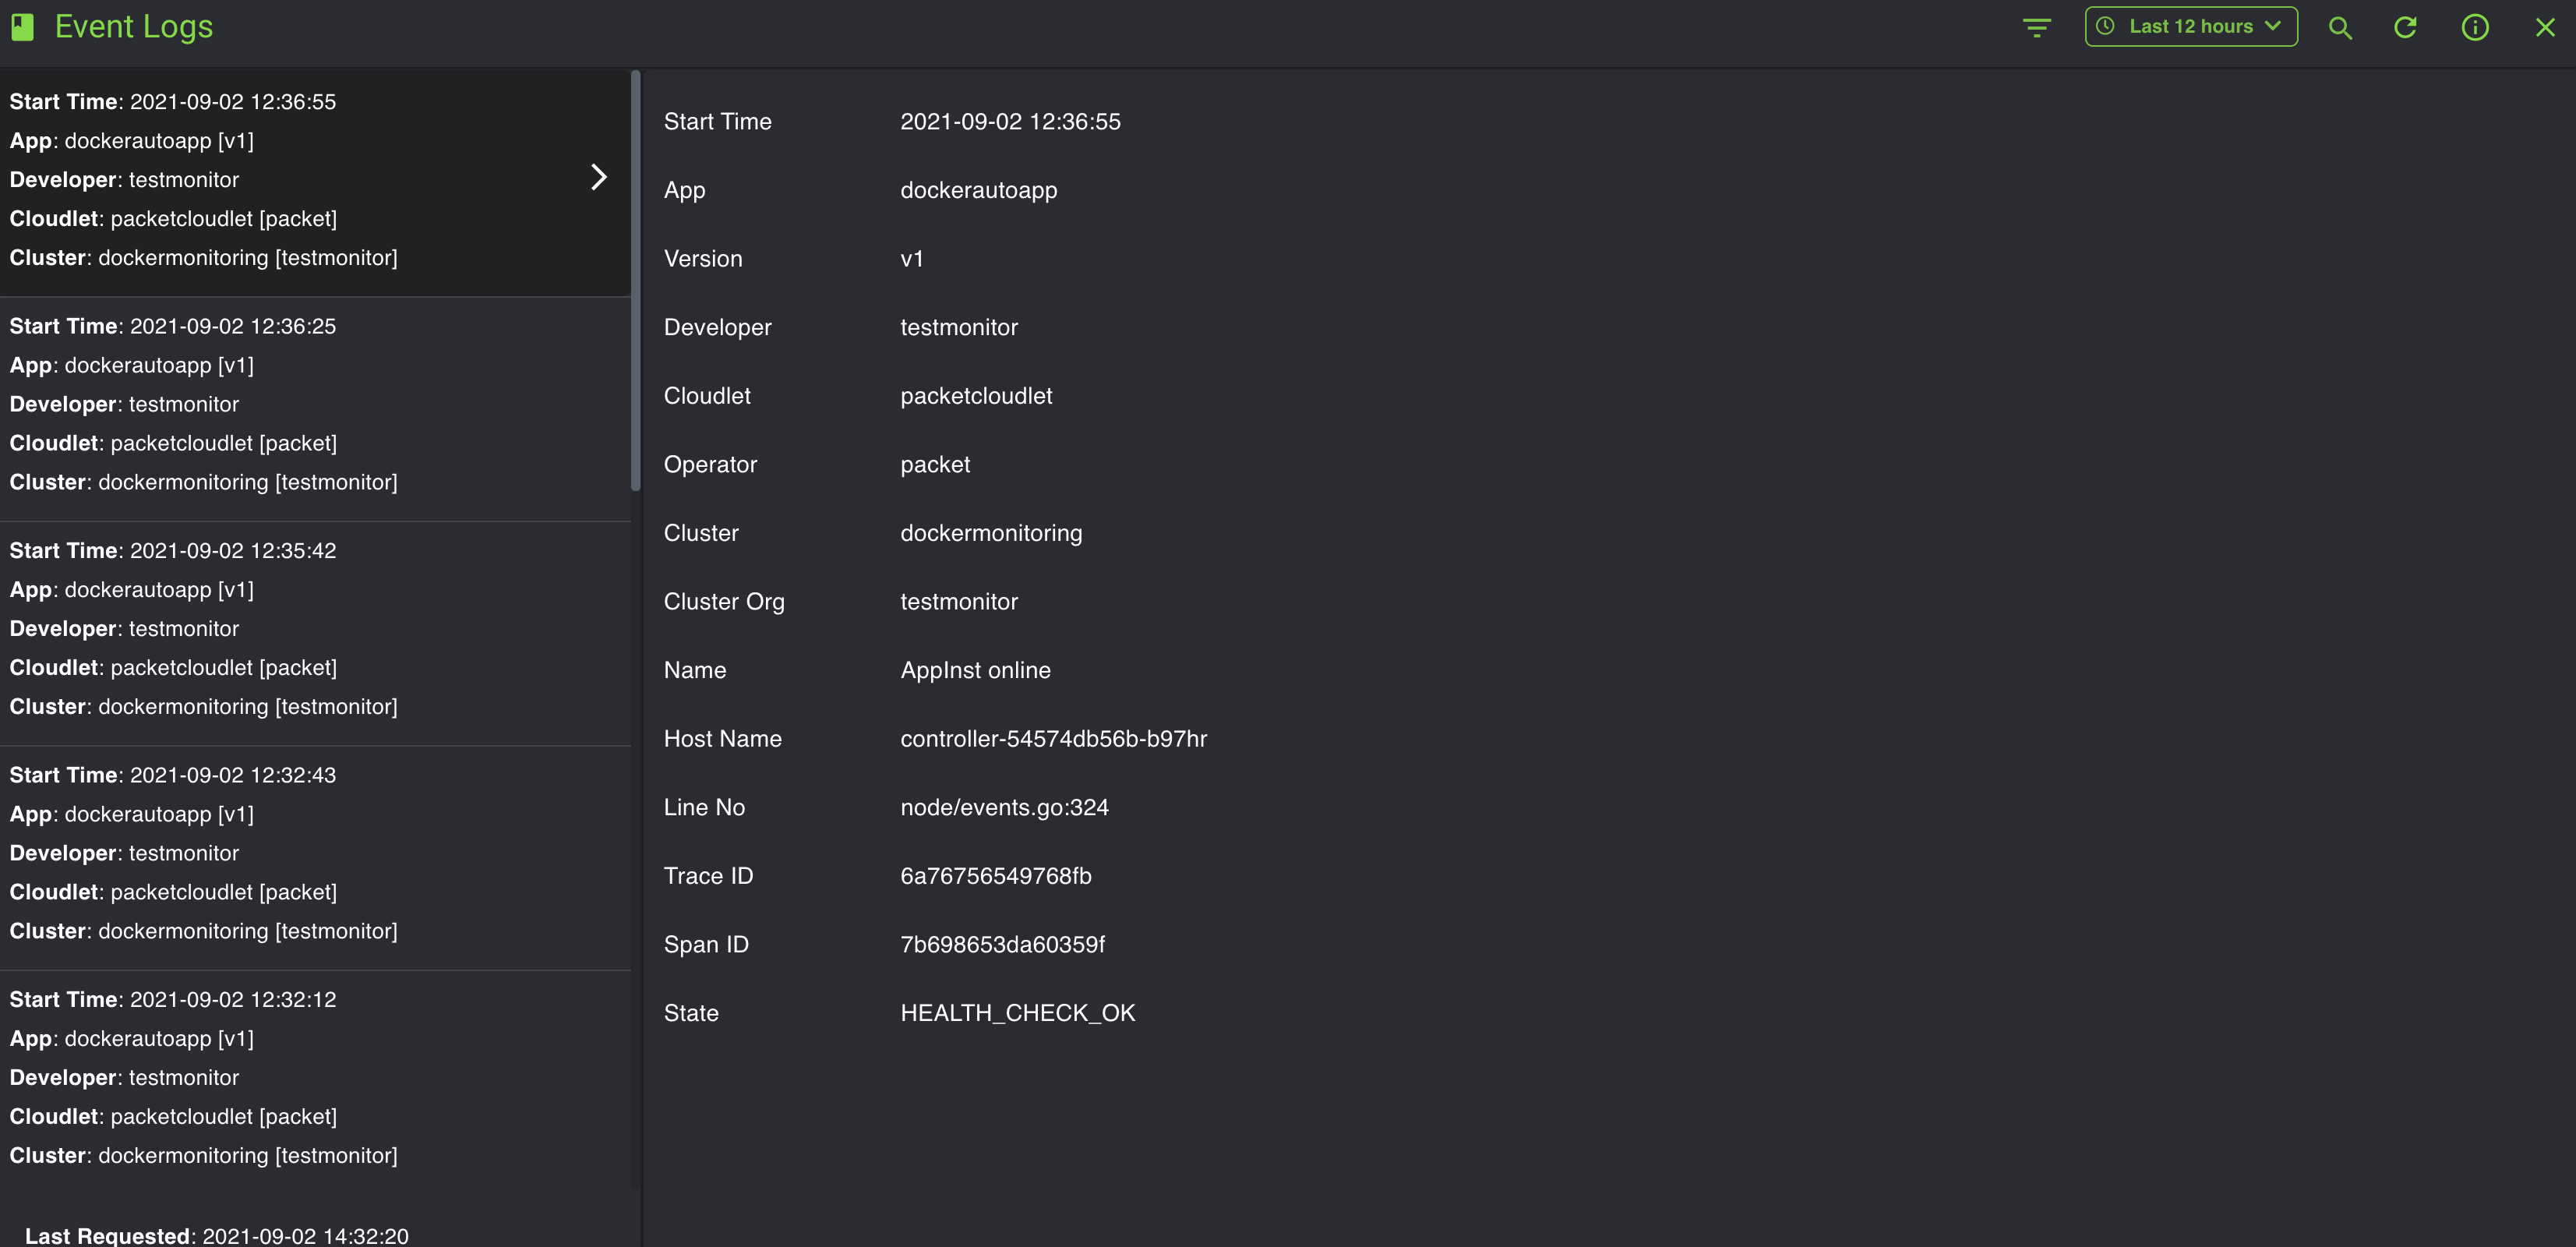
You will see a Live view of the Events log, as shown below.
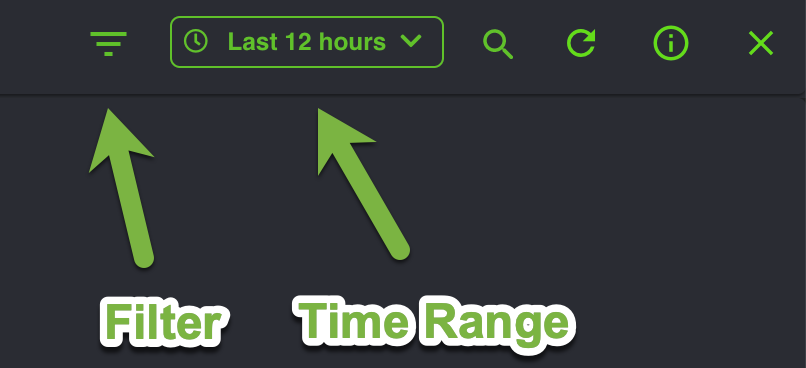
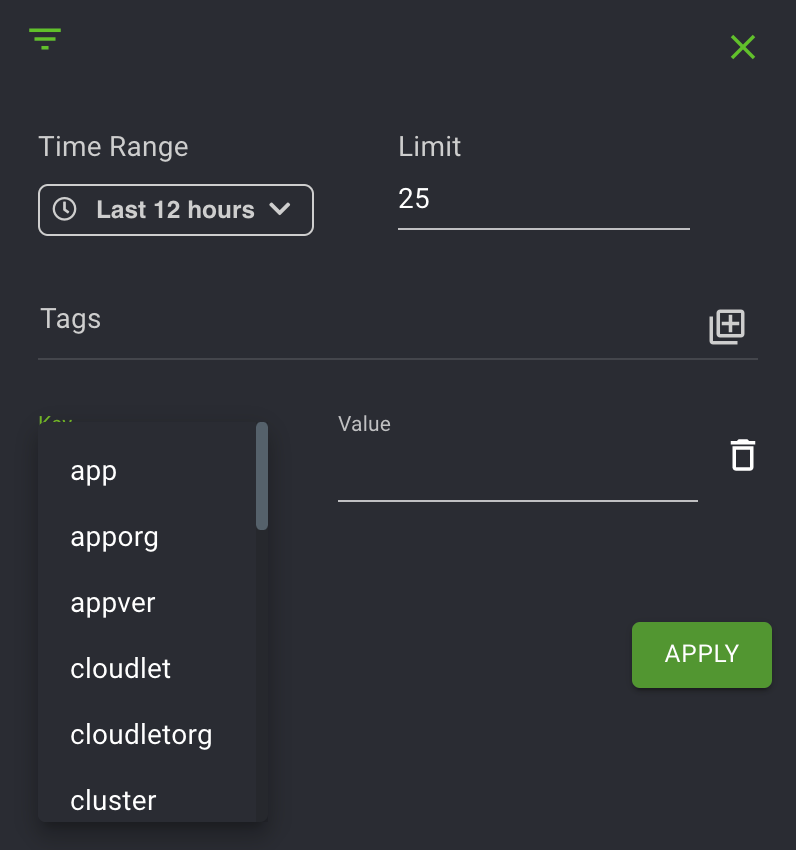
You can also go from the Live view to a more specific search by using the Filter and Time Range icons. Select the filter icon on the top left, as shown below.
You will see the Filter and Tags option, along with a Time range. Click the + sign to expand the Tags. If you do not wish to enter a value for your selected tag, you can input an asterisk in the Value field. Click the + sign multiple times if you wish to add a query using additional tags.
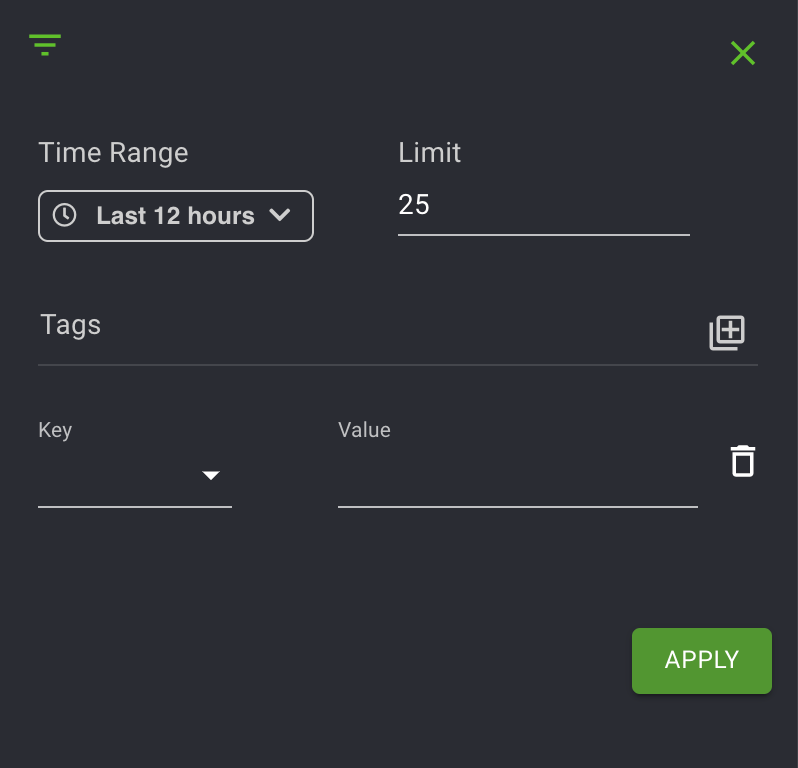
Tags are a list of objects that you can use to query your search. Scroll through the options in the Tag list, specify a date range, and click Fetch. The availability of tags is specific to your role as developer or operator.
The following screen examples show the one-to-one mapping between the UI and CLI command when you use the filter tags to search for the events.
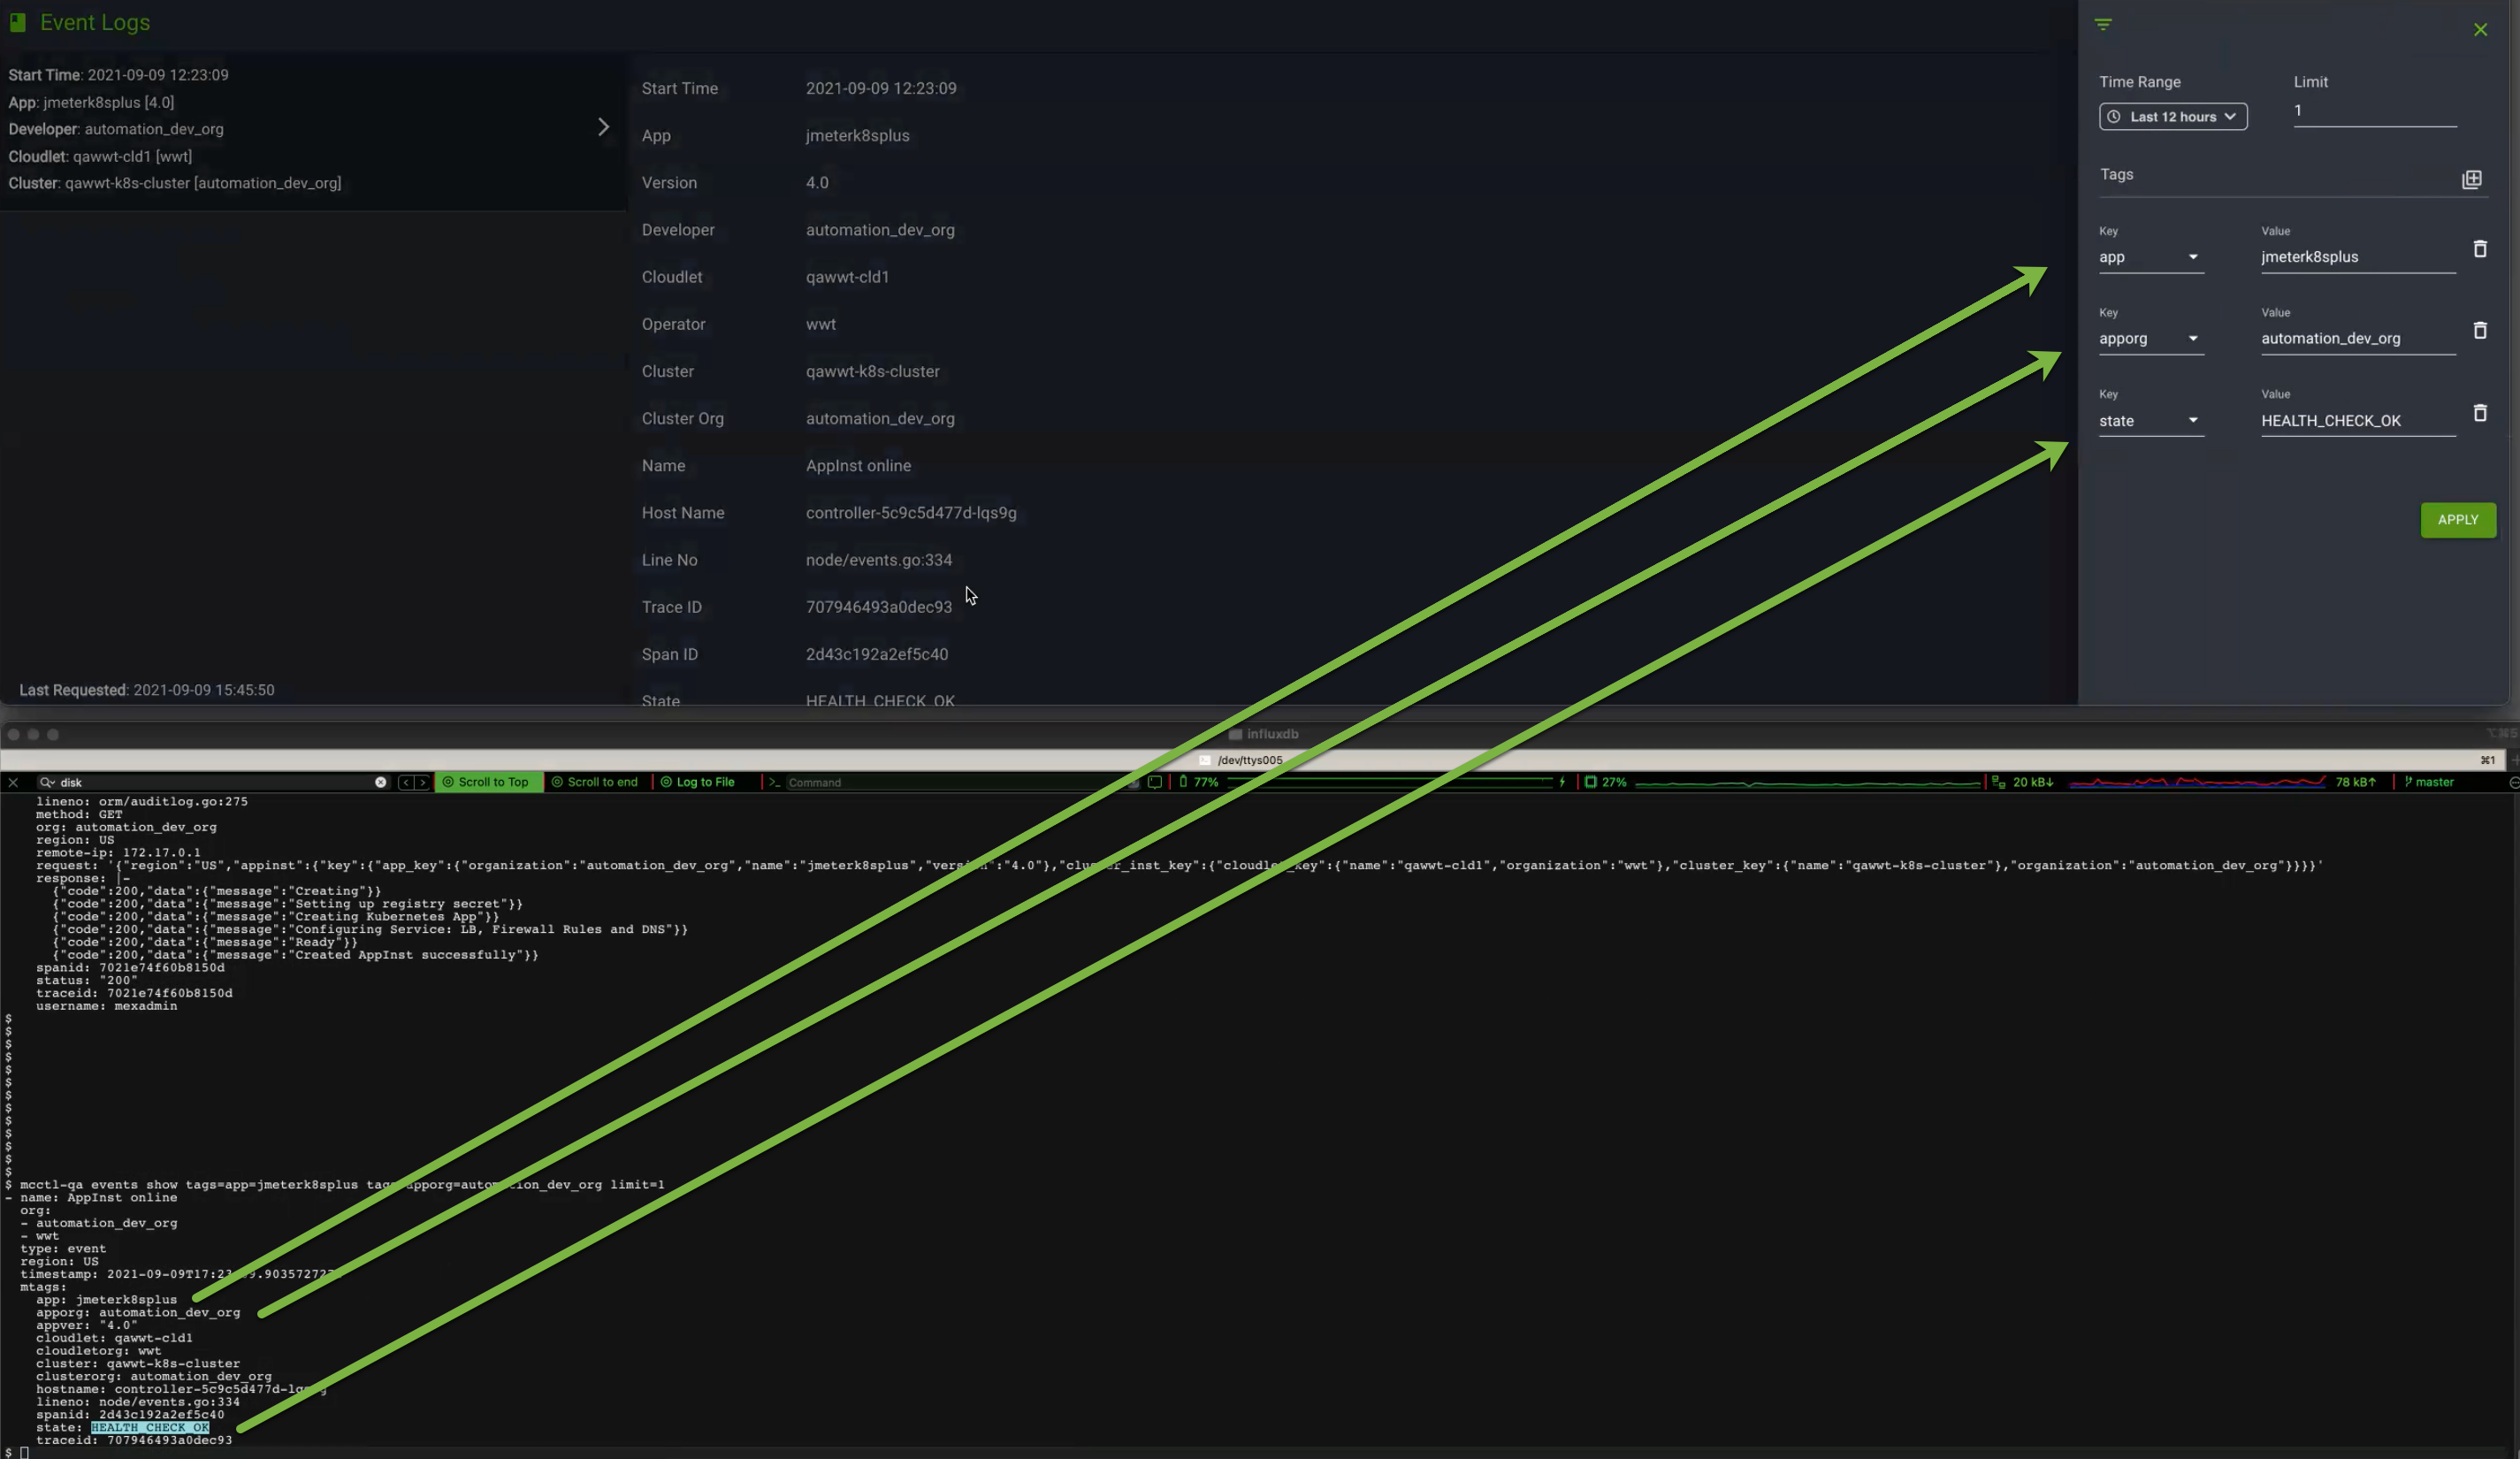
CLI command example mapping to the above UI example:
1 $ mcctl events show tags=apporg=automation_dev_org tags=cloudlet=automation-qa2-vcd-01 tags=state=HEALTH_CHECK_OK  limit=1
2- name: AppInst online
3  org:
4  - automation_dev_org
5  type: event
6  region: US
7  timestamp: 2021-07-13T10:29:39.286515537Z
8  mtags:
9    app: app1626171337-7131228
10    apporg: automation_dev_org
11    appver: "1.0"
12    cloudlet: automation-qa2-vcd-01
13    cloudletorg: packet
14    cluster: cluster1626171337-7131228
15    clusterorg: automation_dev_org
16    hostname: controller-688cf789bf-vfkc5
17    lineno: node/events.go:325
18    spanid: 3a03cb3420d1fbe1
19    state: HEALTH_CHECK_OK
20    traceid: 94303eecf4707f0
Select Audit Logs to view a record of historical events performed by you, your organization's members, or the system. As mentioned earlier, send the Trace ID to EdgeXR Support to assist with troubleshooting.
The following example shows an audit log search and displays the location of where you can find the audit term name. For example, DeleteApp is a term from type=audit.
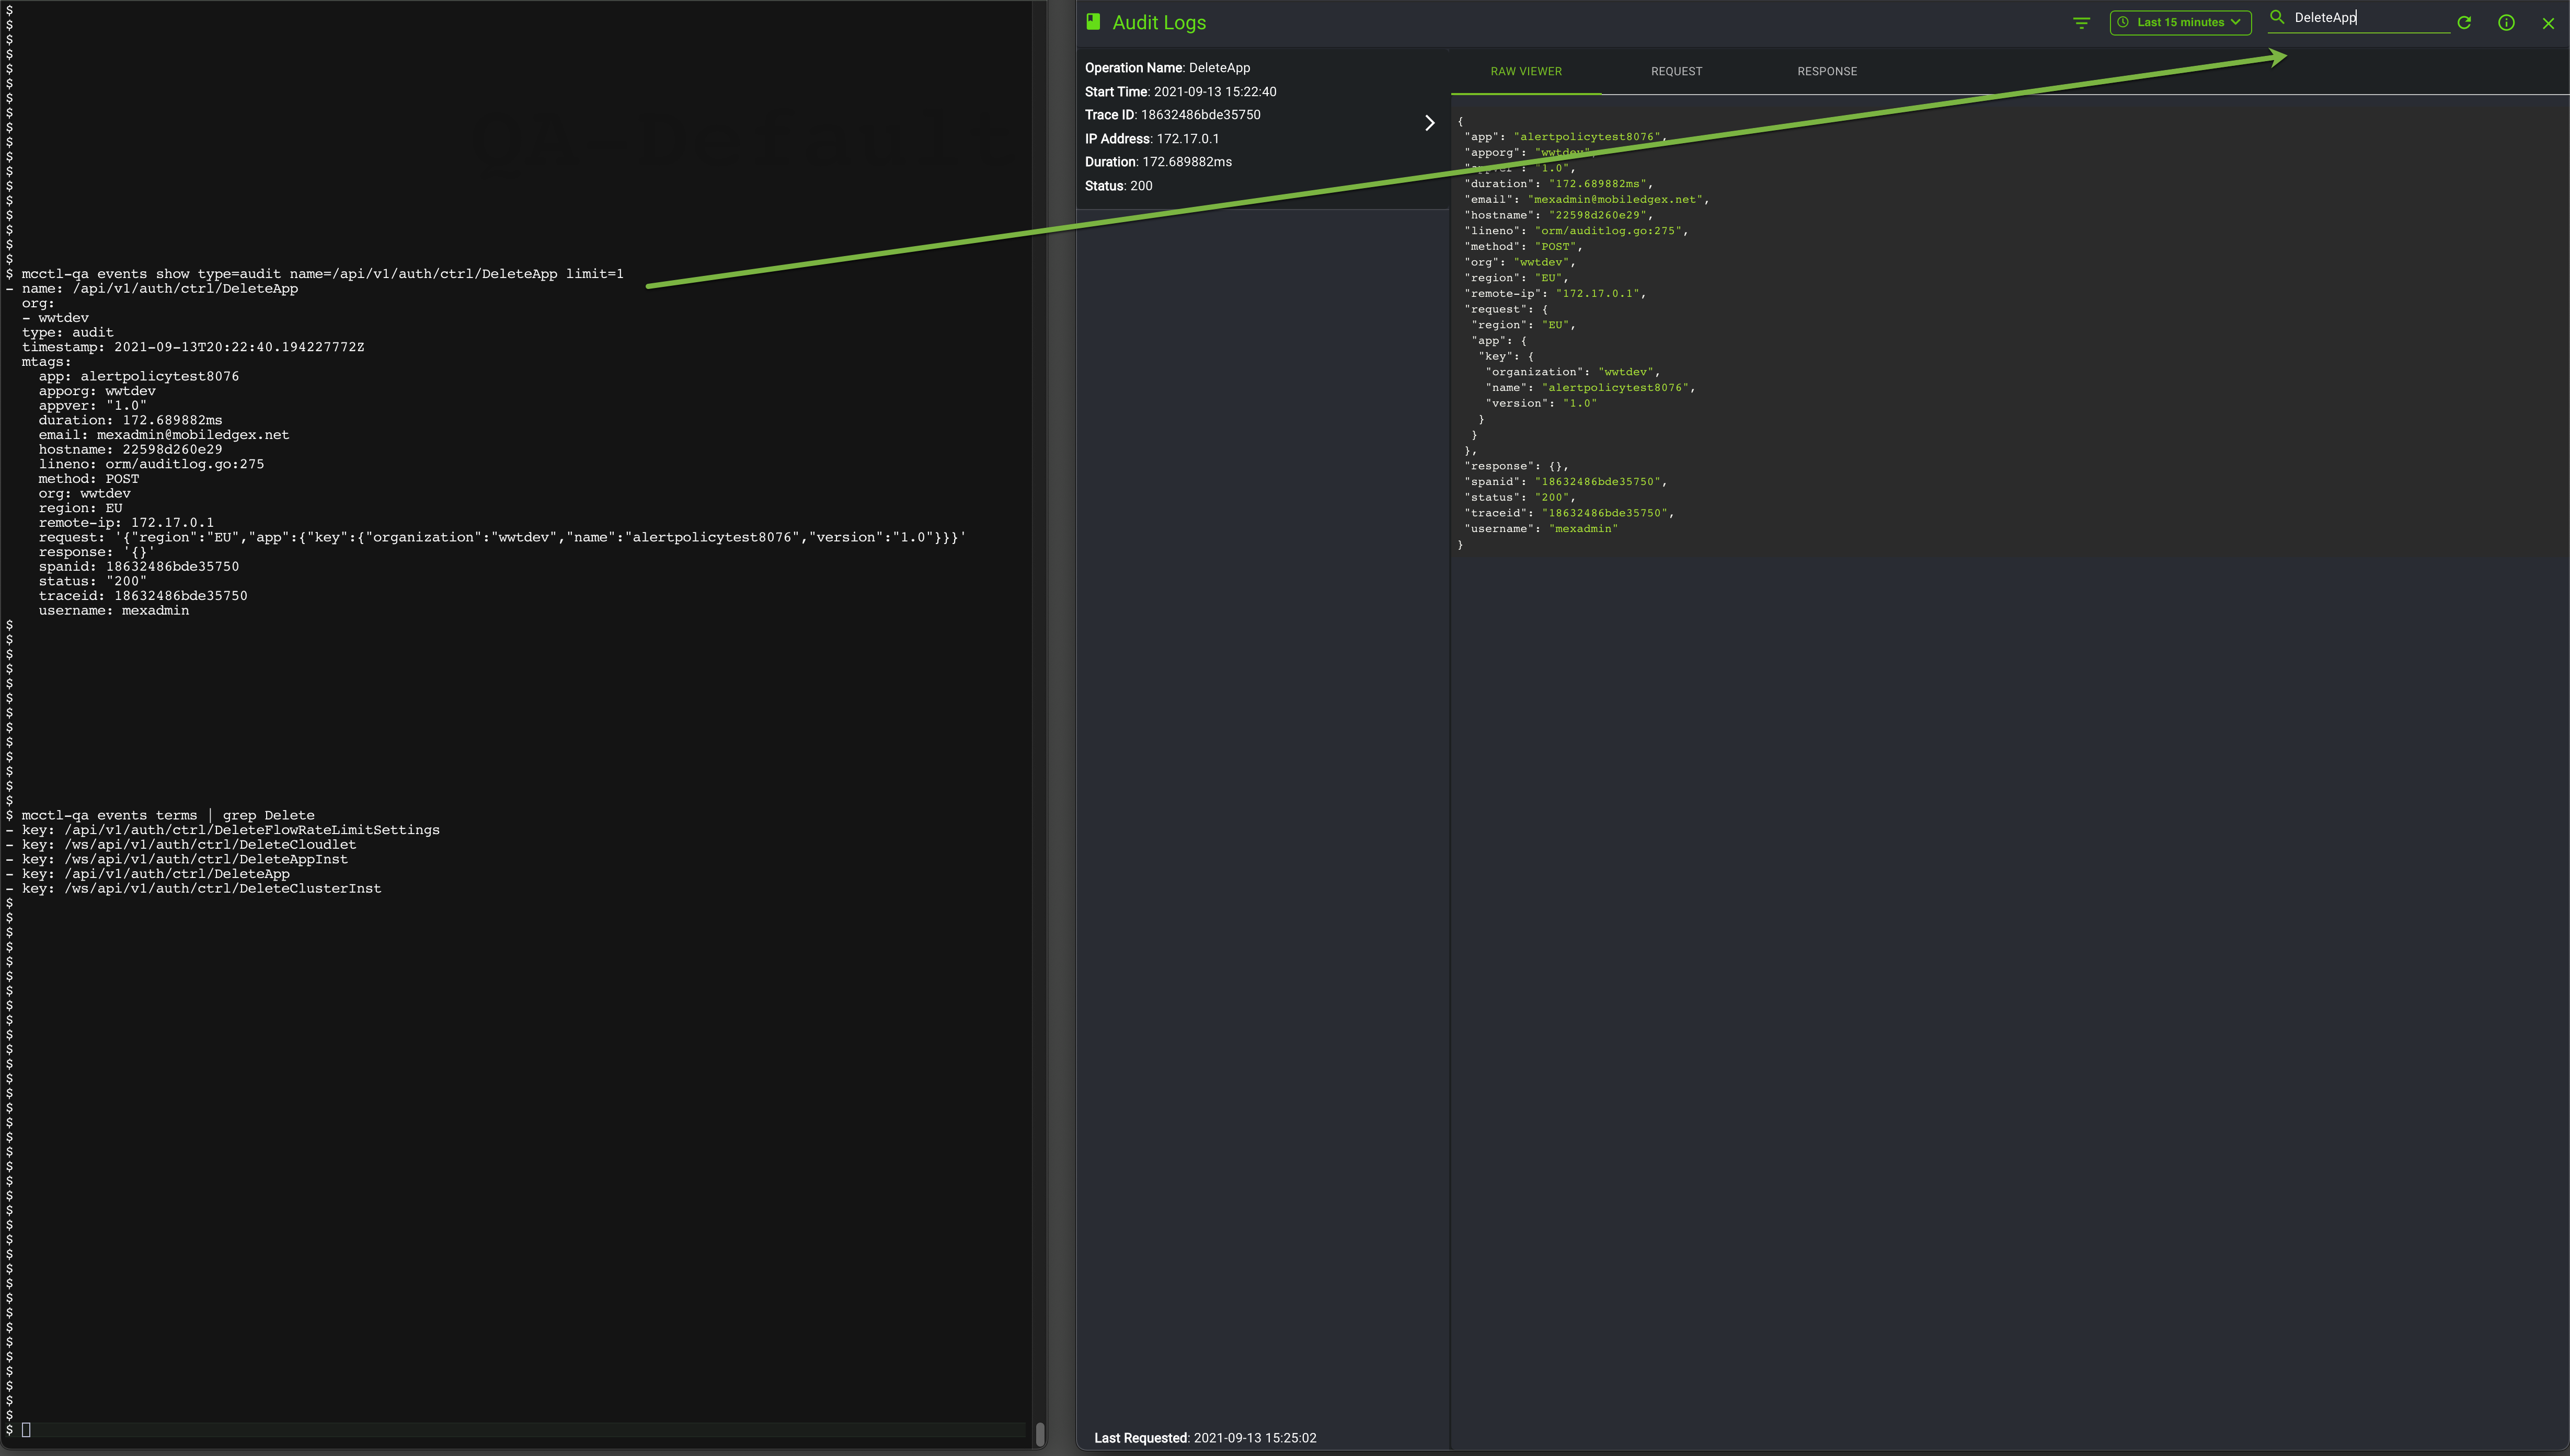
The following screen example shows the one-to-one mapping between the CLI command and the UI when you use the filter to search events.
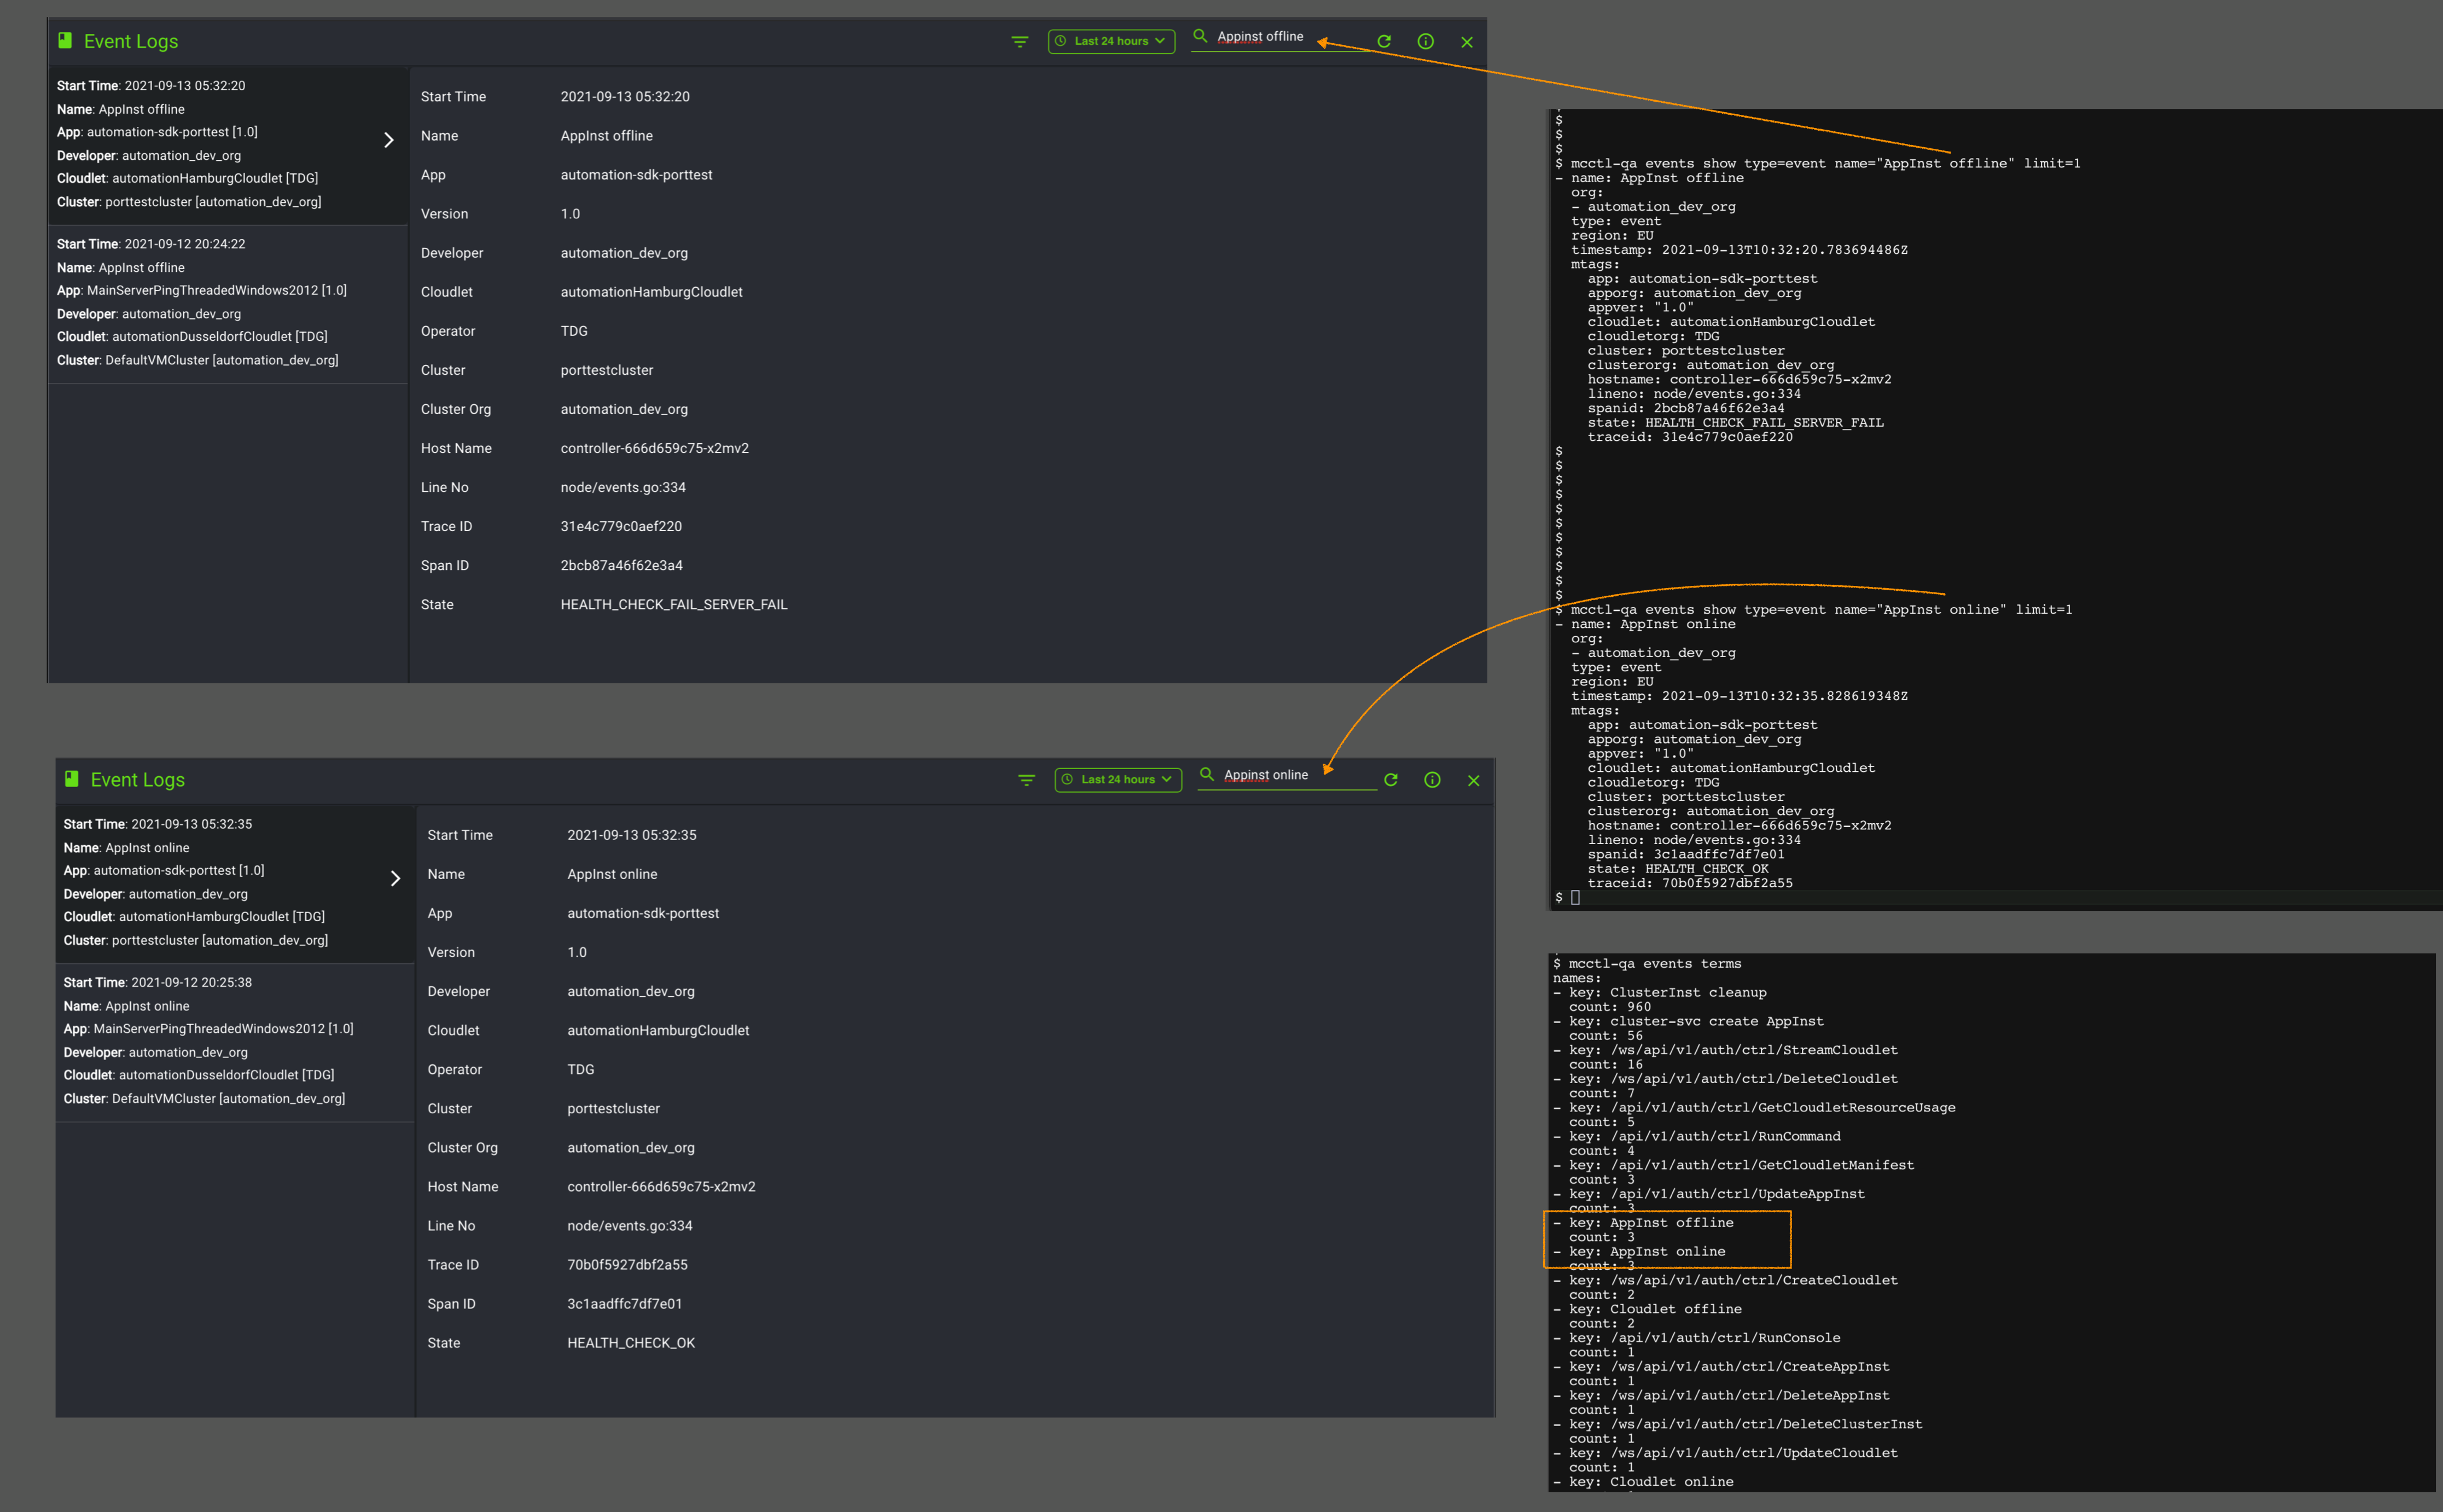
Events list
The following table lists the events supported by our platform, based on roles. The mcctl command to display all the terms can be found in the MCCTL Reference Guide.
Role | Event name |
OperatorManager | Create Cloudlet Pool |
Delete Cloudlet Pool | |
Update Cloudlet Pool | |
Create Cloudlet Pool Access Invitation | |
Update Cloudlet | |
Stream Cloudlet | |
Create Cloudlet | |
Delete Cloudlet | |
Upgrading Cloudlet | |
Cloudlet Online | |
Create GPU Driver | |
Delete GPU Driver | |
Update GPU Driver | |
Update VM Pool | |
Cloudlet Maintenance Done | |
Cloudlet Maintenance Start | |
Cloudlet Offline | |
Add Cloudlet ResMapping | |
Add Rest Tag | |
Delete VM Pool | |
Create VM Pool | |
Add User | |
Remove User | |
Get Cloudlet Resource Usage | |
Get Cloudlet Resource Quota Props | |
Remove Cloudlet Pool Member | |
Add Cloudlet Pool Member | |
Get Cloudlet Manifest | |
Revoke Access Key |
Role | Event name |
DevelopManager | Create App |
Delete App | |
Update App | |
Create App Inst | |
Delete App Inst | |
App Inst Offline | |
App Inst Online | |
Create AutoScale Policy | |
Update AutoScale Policy | |
Delete AutoScale Policy | |
Free Cluster Inst Reservation | |
Create Cluster Inst | |
Reserve Cluster Inst | |
AutoCluster Create | |
Delete Custer Inst | |
Create Cloudlet Pool Access Response | |
Delete Cloudlet Pool Access Response | |
Run Command | |
Show Logs | |
Create Org | |
Add User | |
Remove User | |
Request App Inst Latency | |
Update Cluster Inst | |
Run Console | |
Show App Inst Client | |
Create AutoProv Policy | |
Delete AutoProv Policy | |
Create Cluster Inst | |
Delete App Inst | |
Add AutoProv Policy Cloudlet | |
Remove AutoProv Policy Cloudlet | |
Update App Inst | |
Delete App Inst | |
Delete Cluster Inst | |
Add AutoProv Policy | |
Create App Inst | |
Remove App AutoProv Policy | |
TLS Certs Error |
Usage Logs
You can view application usage (application instances) across client devices, locations, and the number of users connected to those applications. Using this data over time helps you understand the application activity that is occurring within your cloudlets, where you can drill down into specific events and uncover usage trends to measure user engagement. Additionally, you can also retrieve usage information about cluster instances and cloudlet pools. The ability to view cloudlets and cloudlet pool usage are strictly for Operators; Developers do not have the ability to view usage logs outside of cluster instances and application instances.
Using the EdgeXR API to view usage logs
EdgeXR provides two ways for you to view usage logs. The same events that are presented in the Edge-Cloud UI can be viewed from the CLI by using the usage commands in the mcctl utility.
> mcctl usage
Usage: mcctl usage [flags] [command]
Available Commands:
  app           View App usage
  cluster       View ClusterInst usage
  cloudletpool  View CloudletPool usage
The following is an example of the cluster usage logs command.
 mcctl usage cluster region=EU cluster=TDG-Docker-Cluster cluster-org=testmonitor cloudlet-org=TDG starttime=2021-06-14T05:00:00+00:00 endtime=2021-06-16T23:03:07+00:00
2 data:
3 - series:
4  - columns:
5    - region
6    - cluster
7    - clusterorg
8    - cloudlet
9    - cloudletorg
10    - flavor
11    - numnodes
12    - ipaccess
13    - startime
14    - endtime
15    - duration
16    - note
17    name: cluster-usage
18    values:
19    - EU
20      - TDG-Docker-Cluster
21      - testmonitor
22      - automationBerlinCloudlet
23      - TDG
24      - automation_api_flavor
25      - 0
26      - IP_ACCESS_DEDICATED
27      - "2021-06-15T18:33:02.124504691Z"
28      - "2021-06-15T20:15:04.280783803Z"
29      - 6.122156279112e+12
30      - DELETED
31      - EU
32      - TDG-Docker-Cluster
33      - testmonitor
34      - automationBerlinCloudlet
35      - TDG
36      - automation_api_flavor
37      - 2
38      - IP_ACCESS_DEDICATED
39      - "2021-06-15T20:22:36.455527265Z"
40      - "2021-06-16T07:34:10.086085844Z"
41      - 4.0293630558579e+13
42      - DELETED
43      - EU
44      - TDG-Docker-Cluster
45      - testmonitor
46      - automationBerlinCloudlet
47      - TDG
48      - automation_api_flavor
49      - 0
50      - IP_ACCESS_DEDICATED
51      - "2021-06-16T13:07:16.564976337Z"
52      - "2021-06-16T17:13:38.247399481Z"
53      - 1.4781682423144e+13
54      - DELETED
The following is an example of an application instance usage command:
$ mcctl usage app region=US cluster=dockermonitoring appname=app-us cloudlet-org=packet cloudlet= starttime=2020-01-11T05:00:00+00:00 endtime=2021-06-14T23:03:07+00:00 app-org=testmonitor
2data:
3- series:
4  - columns:
5    - region
6    - app
7    - apporg
8    - version
9    - cluster
10    - clusterorg
11    - cloudlet
12    - cloudletorg
13    - flavor
14    - deployment
15    - startime
16    - endtime
17    - duration
18    - note
19    name: appinst-usage
20    values:
21    - - US
22      - app-us
23      - testmonitor
24      - v1
25      - dockermonitoring
26      - testmonitor
27      - packetcloudlet
28      - packet
29      - <nil>
30      - docker
31      - "2021-03-11T06:07:28.18109284Z"
32      - "2021-03-23T15:35:24.971452827Z"
33      - 1.070876790359987e+15
34      - HEALTH_CHECK_FAIL
35    - - US
36      - app-us
37      - testmonitor
38      - v1
39      - dockermonitoring
40      - testmonitor
41      - packetcloudlet
42      - packet
43      - <nil>
44      - docker
45      - "2021-03-23T15:35:40.174447583Z"
46      - "2021-03-24T06:14:57.19314355Z"
47      - 5.2757018695967e+13
48      - HEALTH_CHECK_FAIL
49    - - US
50      - app-us
51      - testmonitor
52      - v1
53      - dockermonitoring
54      - testmonitor
55      - packetcloudlet
56      - packet
57      - <nil>
58      - docker
59      - "2021-03-24T06:15:12.25505126Z"
60      - "2021-04-26T16:29:58.850334201Z"
61      - 2.888086595282941e+15
62      - DELETED
63    - - US
64      - app-us
65      - testmonitor
66      - v1
      - dockermonitoring
68      - testmonitor
69      - packetcloudlet
70      - packet
71      - <nil>
72      - docker
73      - "2021-04-26T17:08:43.816096459Z"
74      - "2021-04-29T15:30:12.323913187Z"
75      - 2.53288507816728e+14
76      - DELETED
77    - - US
78      - app-us
79      - testmonitor
80      - v1
81      - dockermonitoring
82      - testmonitor
      - packetcloudlet
84      - packet
85      - <nil>
86      - docker
87      - "2021-04-29T15:36:57.068458556Z"
88      - "2021-05-04T04:58:09.22534242Z"
89      - 3.93672156883864e+14
90      - HEALTH_CHECK_FAIL
91    - - US
92      - app-us
93      - testmonitor
94      - v1
95      - dockermonitoring
96      - testmonitor
97      - packetcloudlet
98      - packet
99      - <nil>
100      - docker
101      - "2021-05-04T04:58:24.325805291Z"
102      - "2021-05-05T06:39:38.782789994Z"
103      - 9.2474456984703e+13
104      - HEALTH_CHECK_FAIL
105    - - US
106      - app-us
107      - testmonitor
108      - v1
109      - dockermonitoring
110      - testmonitor
111      - packetcloudlet
112      - packet
113      - <nil>
114      - docker
115      - "2021-05-05T06:39:53.978863752Z"
116      - "2021-05-10T15:56:06.553279919Z"
117      - 4.65372574416167e+14 118      - DELETED
For more information on these commands and usages, refer to the MCCTL Reference Guide. For this guide, we will be focusing more on using the user interface to view the different usage logs.
Using the Edge-Cloud Console to view usage logs
Usage logs pull data in from your existing configurations for application instances, clusters, cloudlets, etc. Therefore, if you delete an app instance, for example, and refresh the Usage log, the usage log will indicate that it was deleted.
Select the Usage Logs from the Logs Column on the right side of the console.
The following is an example screen displayed when you click Usage log.
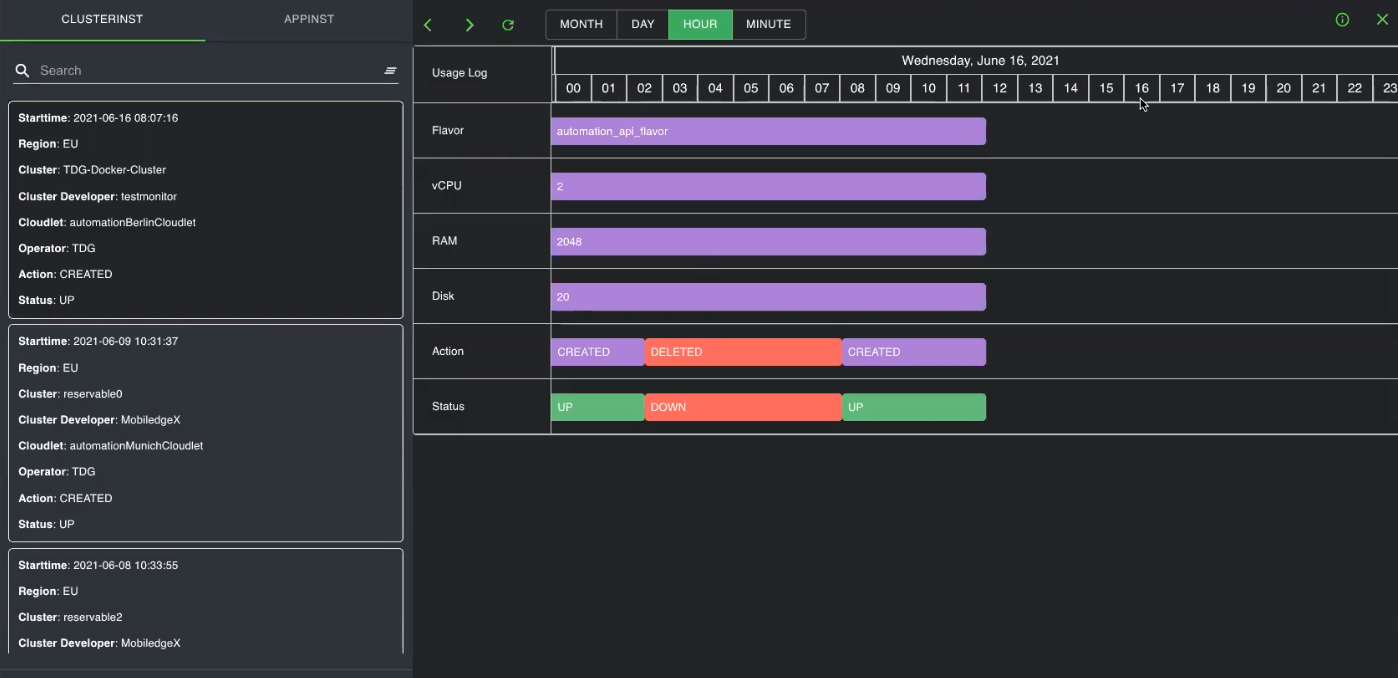
The left panel contains tabs to view detailed information about cluster instances, app instances, etc., depending on your selections. Underneath those options are specific information detailing things such as start time, region, action, status, etc. You can view the items specific to the available selection--cluster instance, app instance, cloudlets, etc. For example, if you want to see a cluster instance usage log, you will see items like Flavors, vCPU, RAM, and Disk.
The right panel contains the actual usage logs for these objects where you can view information such as actions and status. You may filter the logs based on month, day, hour, or minute. The left and right arrow icons will move through selections of the highlighted time interval. If you would like to return to the current time interval, select the Today icon, which looks like a calendar. The time interval can be changed by selecting Month, Day, Hour, or Minute.

The Action row contains color-coded bars, indicating whether something was created or deleted while the Status row contains color-coded bars to indicated whether the object is up or down. By clicking and dragging the bar, you can expand your view to extend the dates.
Metrics
Metrics refer to the availability of resources such as vCPU, memory, disk, RAM, etc. The EdgeXR platform collects metrics for the following components.
Cloudlets
Clusters
Application Instances
Collecting resource metrics is useful if you use them in conjunction with alerts that can help you identify issues and quickly respond to them. For example, you can set alerts and be notified when you have exceeded the threshold for vCPU. Metric information can also be useful when you want to understand the utilization of your resources to determine the percentage of your resource's capacity that is in use and whether to increase them based on user demand.
Using the EdgeXR API to view metrics
EdgeXR provides two ways for you to view metrics. The same metrics information that are presented in the Monitoring Dashboard can be viewed from the CLI by using the metrics commands in the mcctl utility.
> mcctl metrics
Usage: mcctl metrics [flags] [command]
Available Commands:
  app                  View App metrics
  cluster              View ClusterInst metrics
  cloudlet             View Cloudlet metrics
  cloudletusage        View Cloudlet usage
  clientapiusage       View client API usage
  clientappusage       View client App usage
  clientcloudletusage  View client Cloudlet usage
For more information on these commands and usages, refer to the mcctl Utility Reference guide. For this guide, we will be focusing more on using the user interface to view metrics information.
Using the monitoring dashboard to view metrics
From the Edge-Cloud Console UI, select Monitoring from the left navigation. The Monitoring page opens. Make sure that you are managing the Organization that you wish to view metrics information.
The EdgeXR Edge-Cloud Console provides a Monitoring Dashboard to help you visually centralize, collect, aggregate, and analyze events, logs, and traces so that you can get a bigger picture of what is going on across your infrastructure in real-time. Within a single pane of glass and a customizable UI to enlarge your view and change the graphic representation of your data, you can view both current and historical data, log and analyze pattern usages and trends to make informed decisions about your infrastructure to help your users get the most out of your services offered.
Filtering
The Monitoring Dashboard provides many ways to filter the data you need to view and access. You can view by organization, regions, metric types, app instance, cluster instance or cloudlet, and search by admins, developers, or operators. You can also filter by time ranges. While the maximum allocated days you can search for audit logs is one day (within the last 24hrs), you can further refine your search for logs with the span of the 24 hour period. Start time default is 12:00a.m. and End Time default is 11:59p.m.
You can also refresh your data and specify your refresh rate by seconds, minutes, or hours. You will see a progress bar at the top of the page which serves as an indicator. Click the eye icon to customize your view and include specific metrics information.
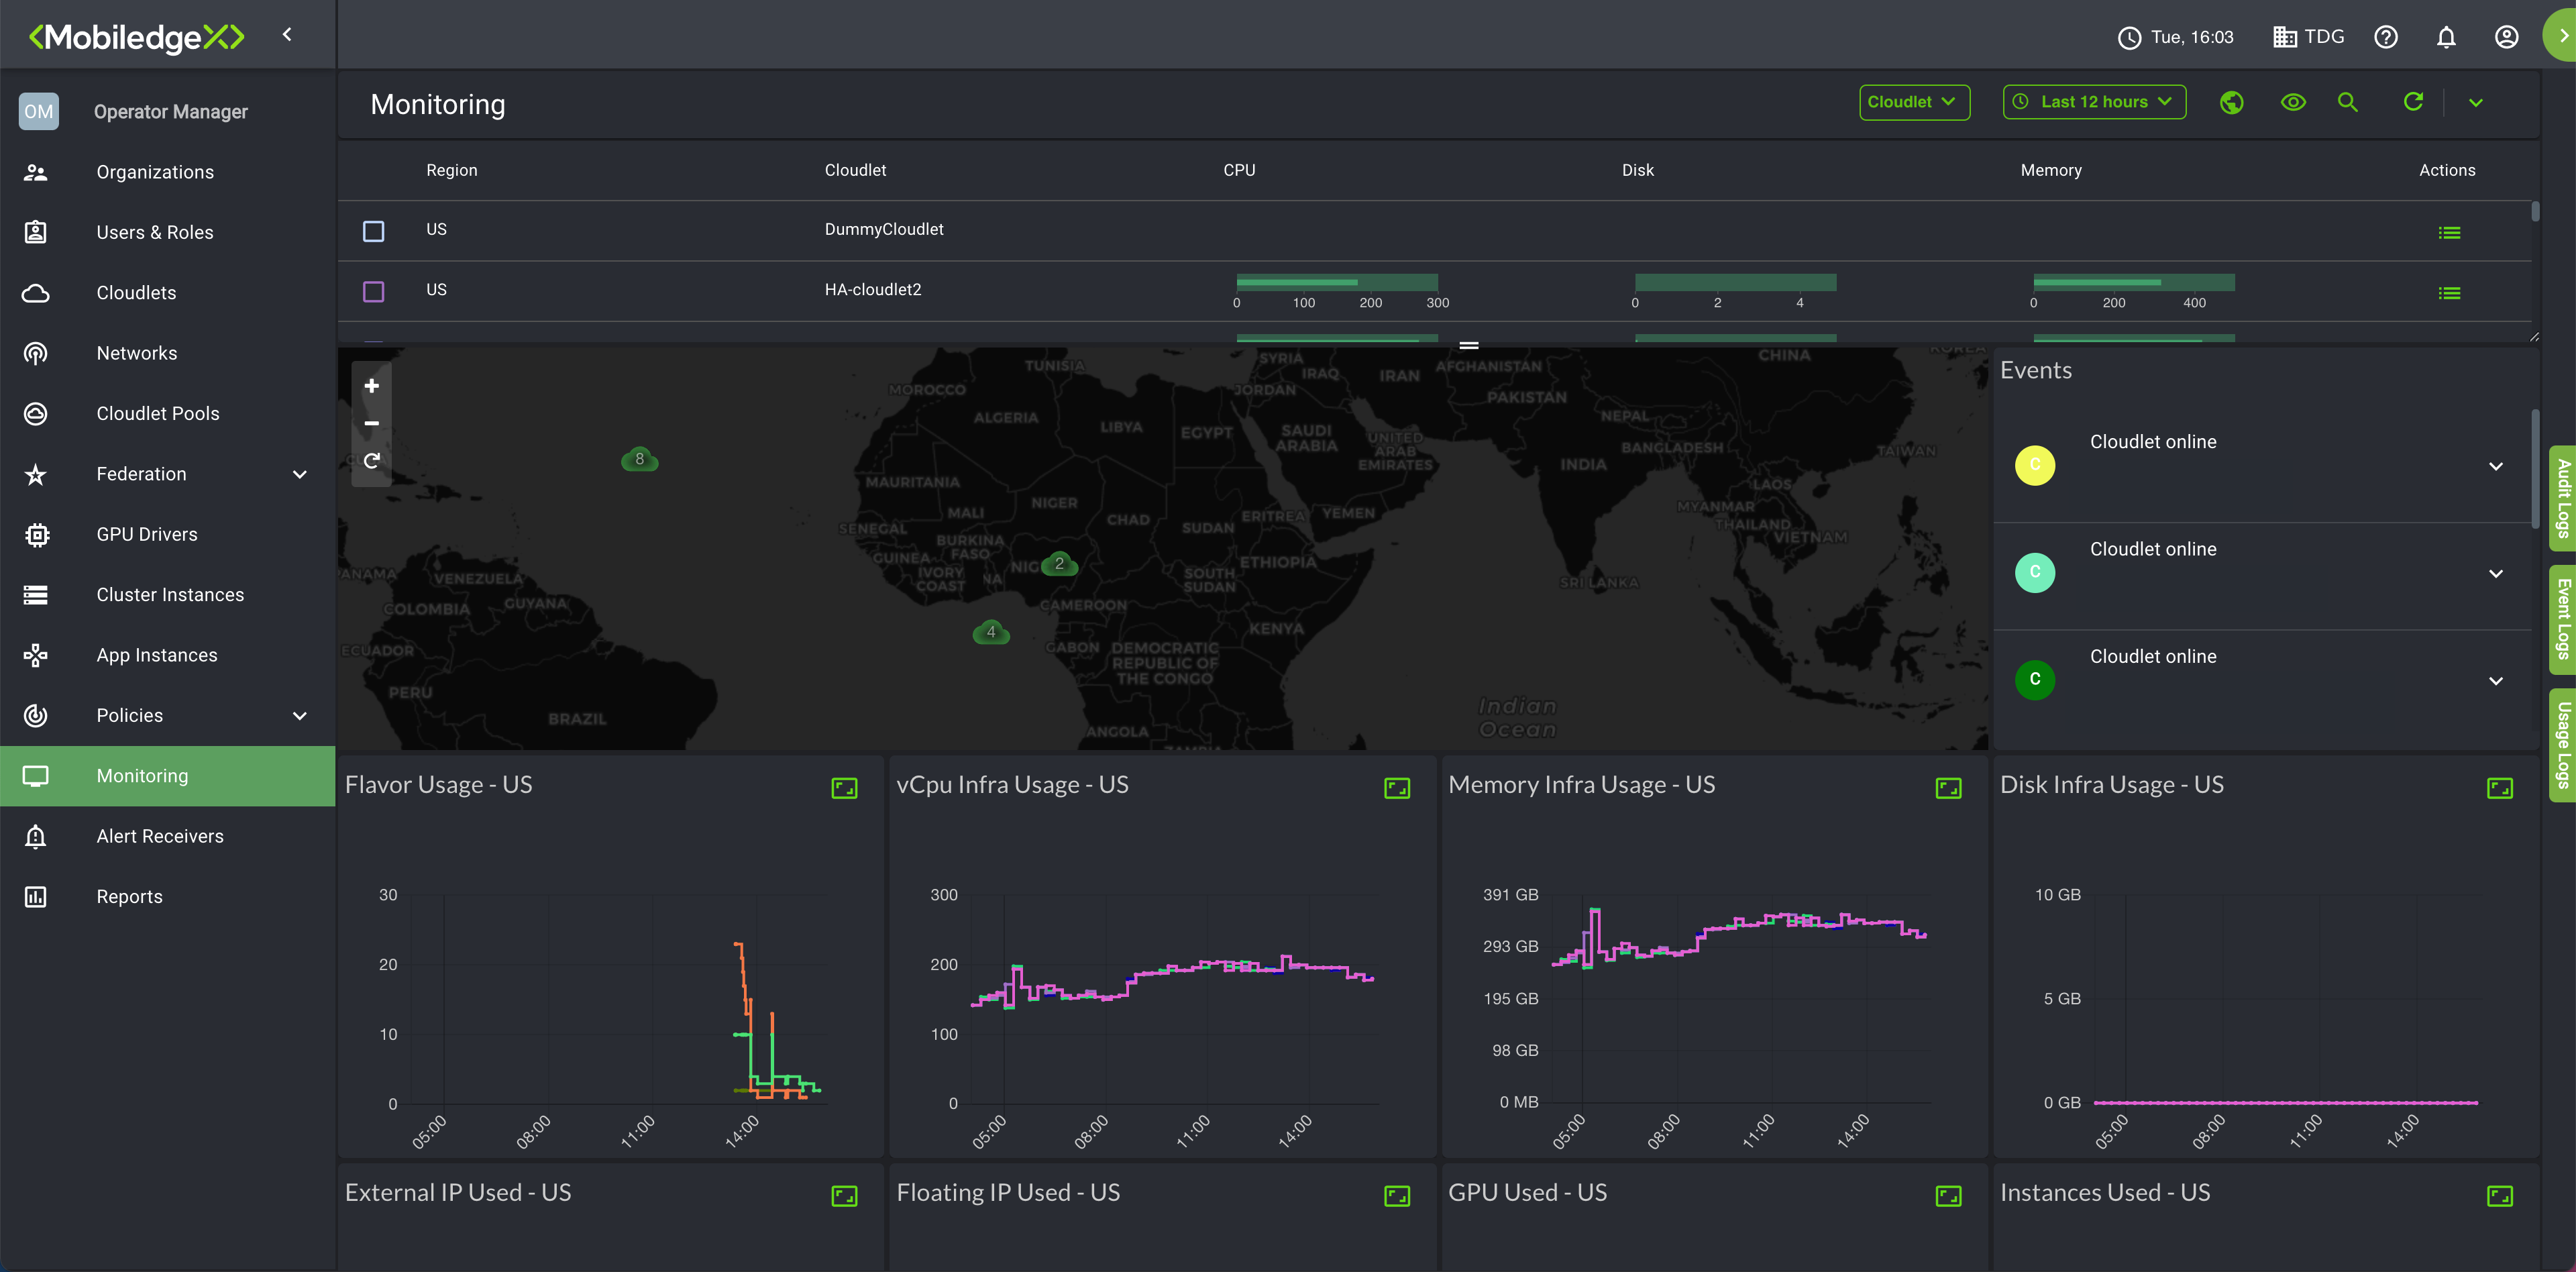
You may find the following information displayed on your Monitoring Dashboard:
Cluster level resource utilization, performance, and status metrics
Load balancer (Layer 4) metrics and status
Application Instance resource utilization, performance, and status metrics
Application Instance event logs, showing state changes and other Application Instance events
Distributed Matching Engine (DME) metrics, including location-based metrics for remote users
Cloudlet level information including regions, operator, disk and memory usage, and more.
More on metrics
The following table provides a list of metrics and their details for each cluster, application instance, and cloudlets. Head over to the mcctl Utility Reference guide for more information on their commands and example usages.
Cluster Metrics
Metric | Measurement Unit | Measurement Detail |
CPU | Percentage | CPU usage expressed as a percentage of allocated CPU. |
MEM | Percentage | Memory usage expressed as a percentage of allocated Memory. |
DISK | Percentage | Filesystem usage expressed as a percentage of available disk. |
NET | Bytes/Sec | Transmit and Received data expressed as bytes/sec averaged over sixty seconds (60s) |
TCP | Integer | Total number of tcp connections / retransmissions expressed as an integer. |
UDP | Integer | Total number of udp datagrams transmitted and received, plus any errors expressed as an integer. |
Application Instances
Metric | Measurement Unit | Measurement Detail |
CPU | Percentage | CPU usage expressed as a percentage of allocated CPU. |
MEM | Bytes | Memory footprint expressed in Bytes. |
DISK | Bytes | Filesystem usage expressed in Bytes. |
NET | Bytes/Sec | Transmit and Received data expressed as bytes/sec averaged over sixty seconds (60s) |
Connections per Port (Bytes Sent/Received) | Bytes/Sec | Bytes sent/received averaged over sixty seconds (60s). |
Connections per Port (Sessions) | Sessions | Count for accepted, handled, and active sessions. |
Connections per Port (Session Time Histogram) | Connection time in ms. | Data is reported for:
|
Cloudlet Metrics
Metric | Measurement Unit | Measurement Detail |
Utilization | Multiple; based on context |
|
Network | Bytes | Broken down by bytes sent and bytes received. |
Multiple; based on context |
|
Viewing Aggregated Statistical Data
You can view latency statistics and filter them by cloudlet, location, and data network type. Device information statistics, such as the number of devices, type of devices, and the number of clients/locations are aggregated over cloudlet, device OS, device model, carrier, and location. It's important to note that user data and location are not being stored.
1. From the Monitoring page, select the Actions menu and click Show Latency Metrics.
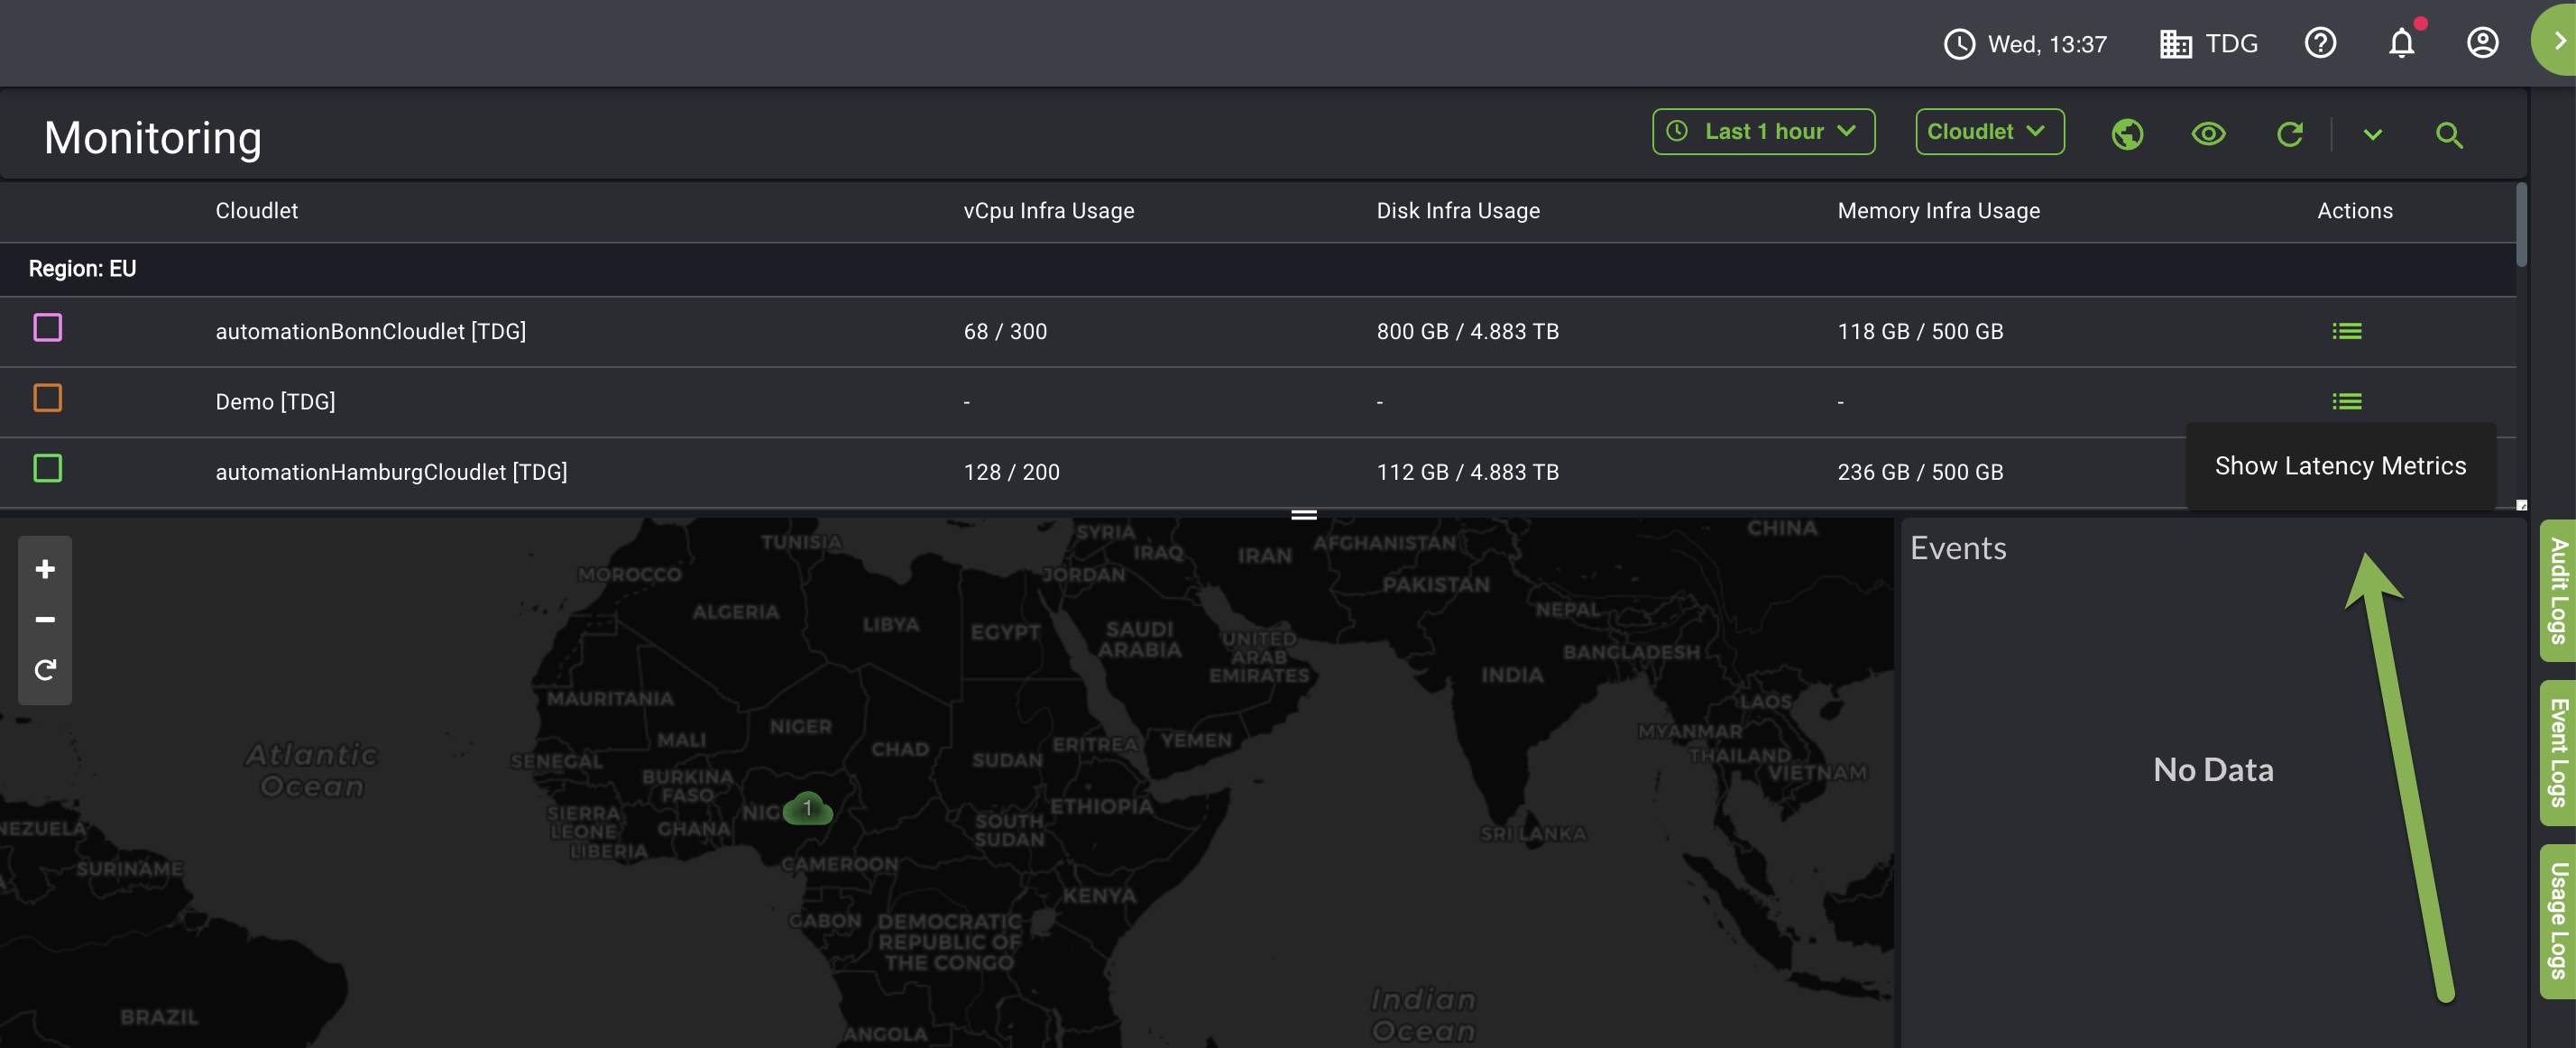
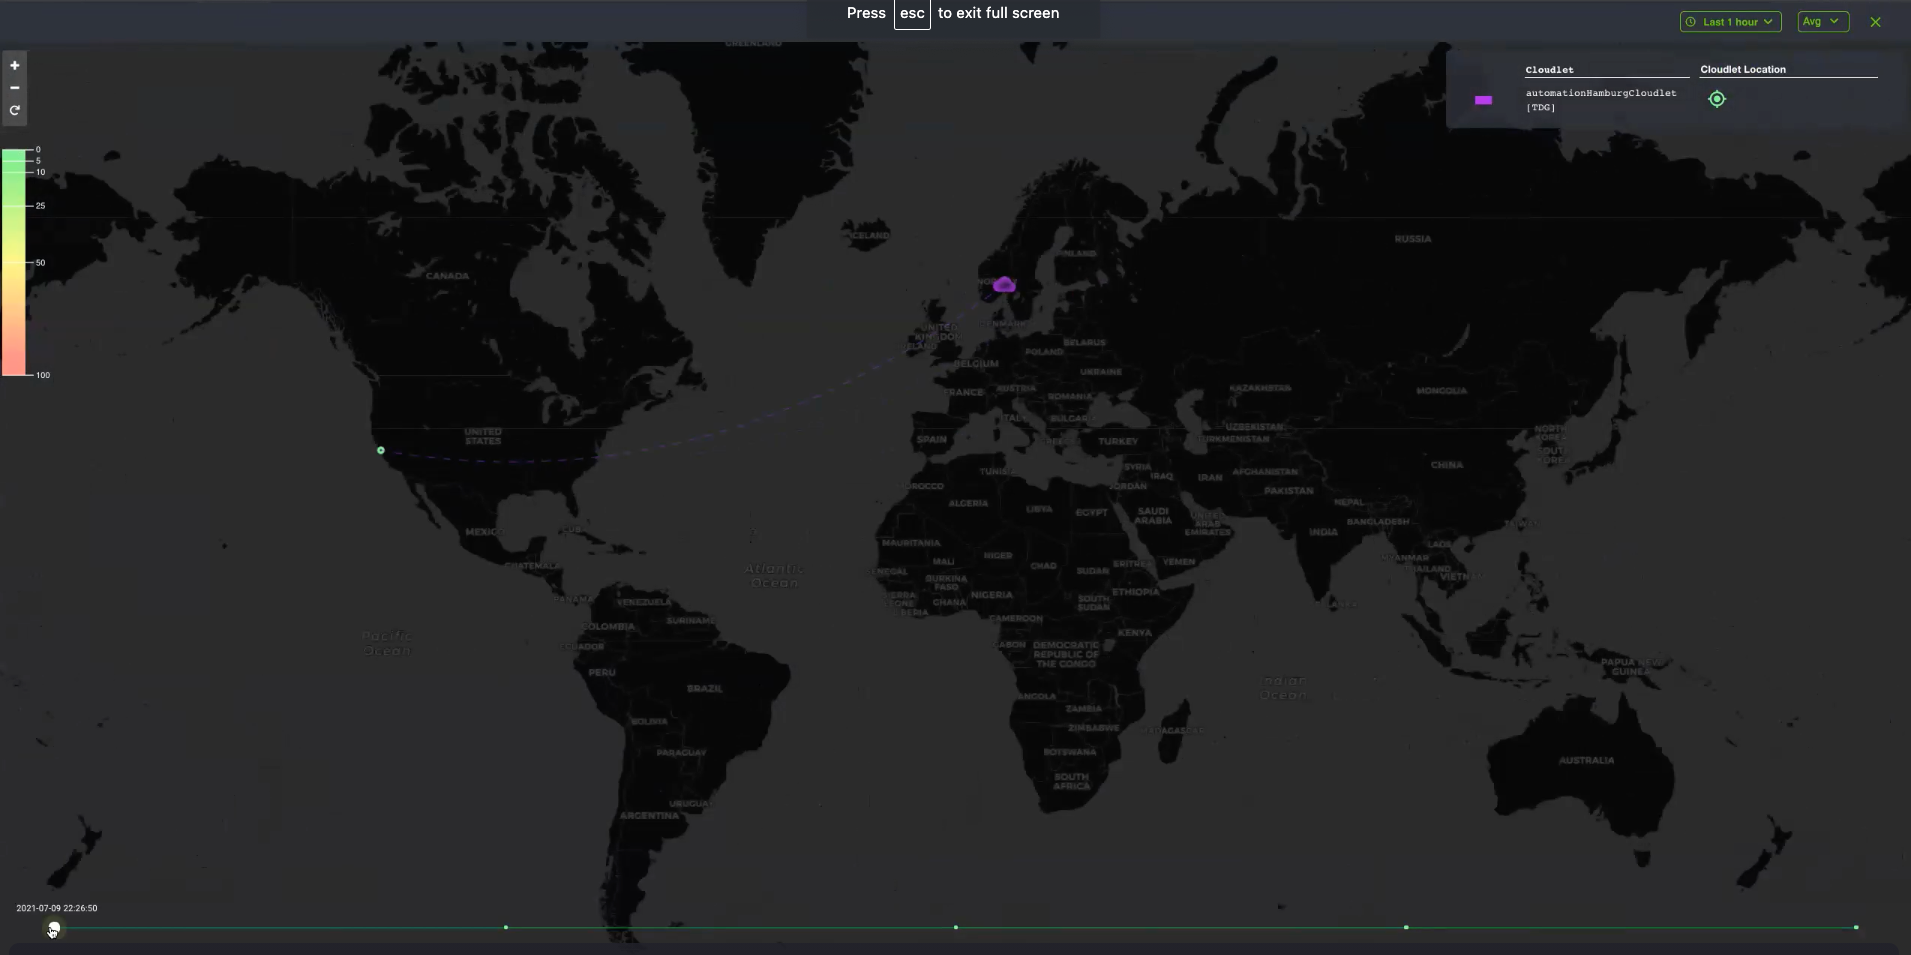
From the Default view page, the time slider appears at the bottom of the page where you can slide to view aggregated data for the available period of time. The top left side of the screen displays the latency bar (heatmap) while the upper-hand corner of the screen displays cloudlet details.
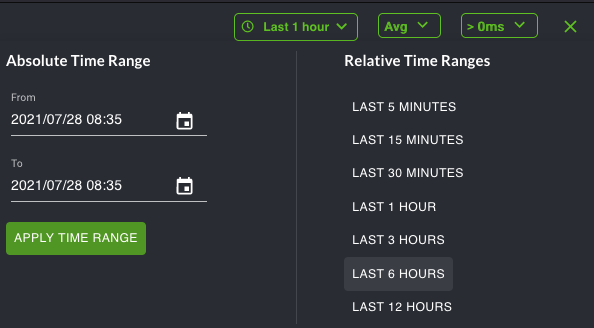
Use the drop-down box on the upper-righthand side to specify the absolute time range and apply it or select a relative time range.
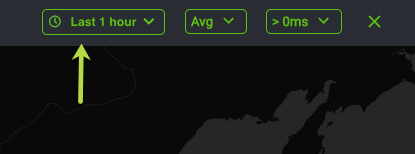
You can also filter latency data by avg. min, and max.
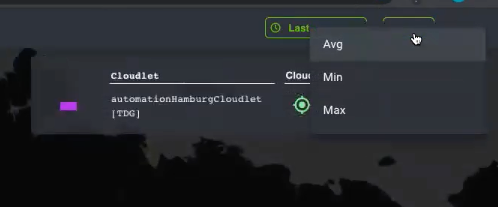
Click the target location icon under Cloudlet Location to display the Cloudlet location view.

The Cloudlet location default page opens.
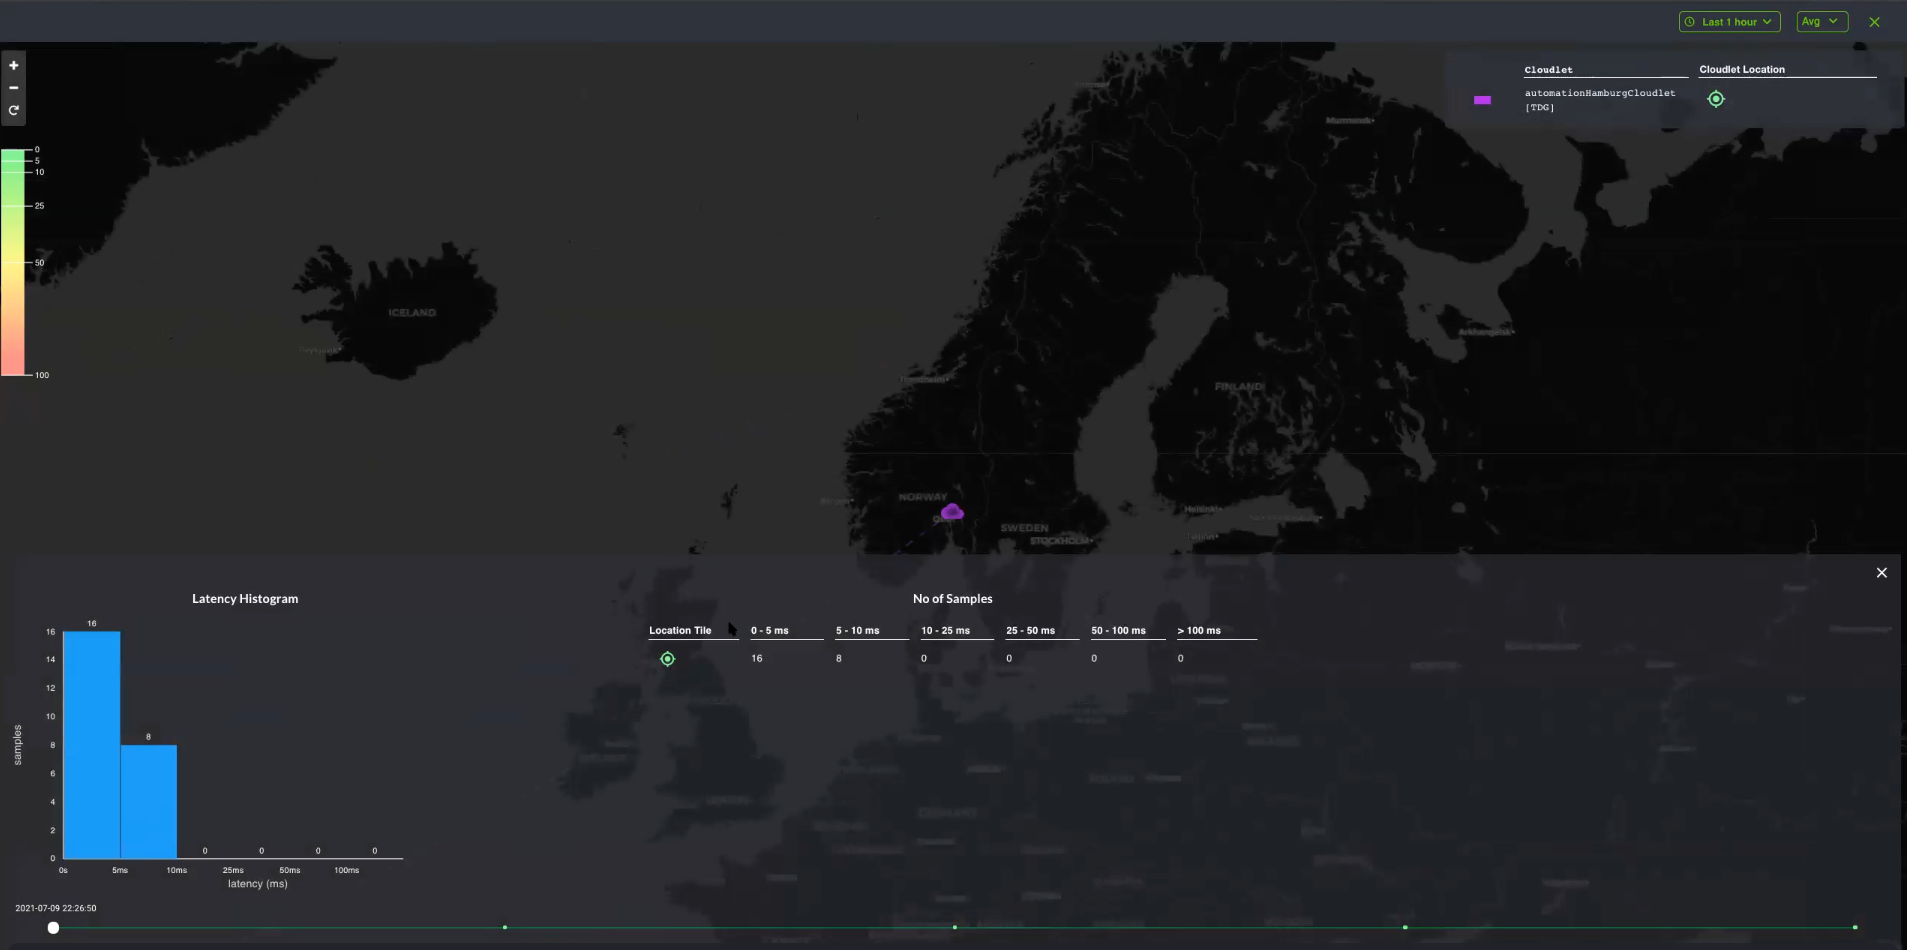
The purple cloud that you see in the sample above displays the average latency data based on cloudlets, and not location.
To drill-down latency data for a specific location type, click the Location Tile.

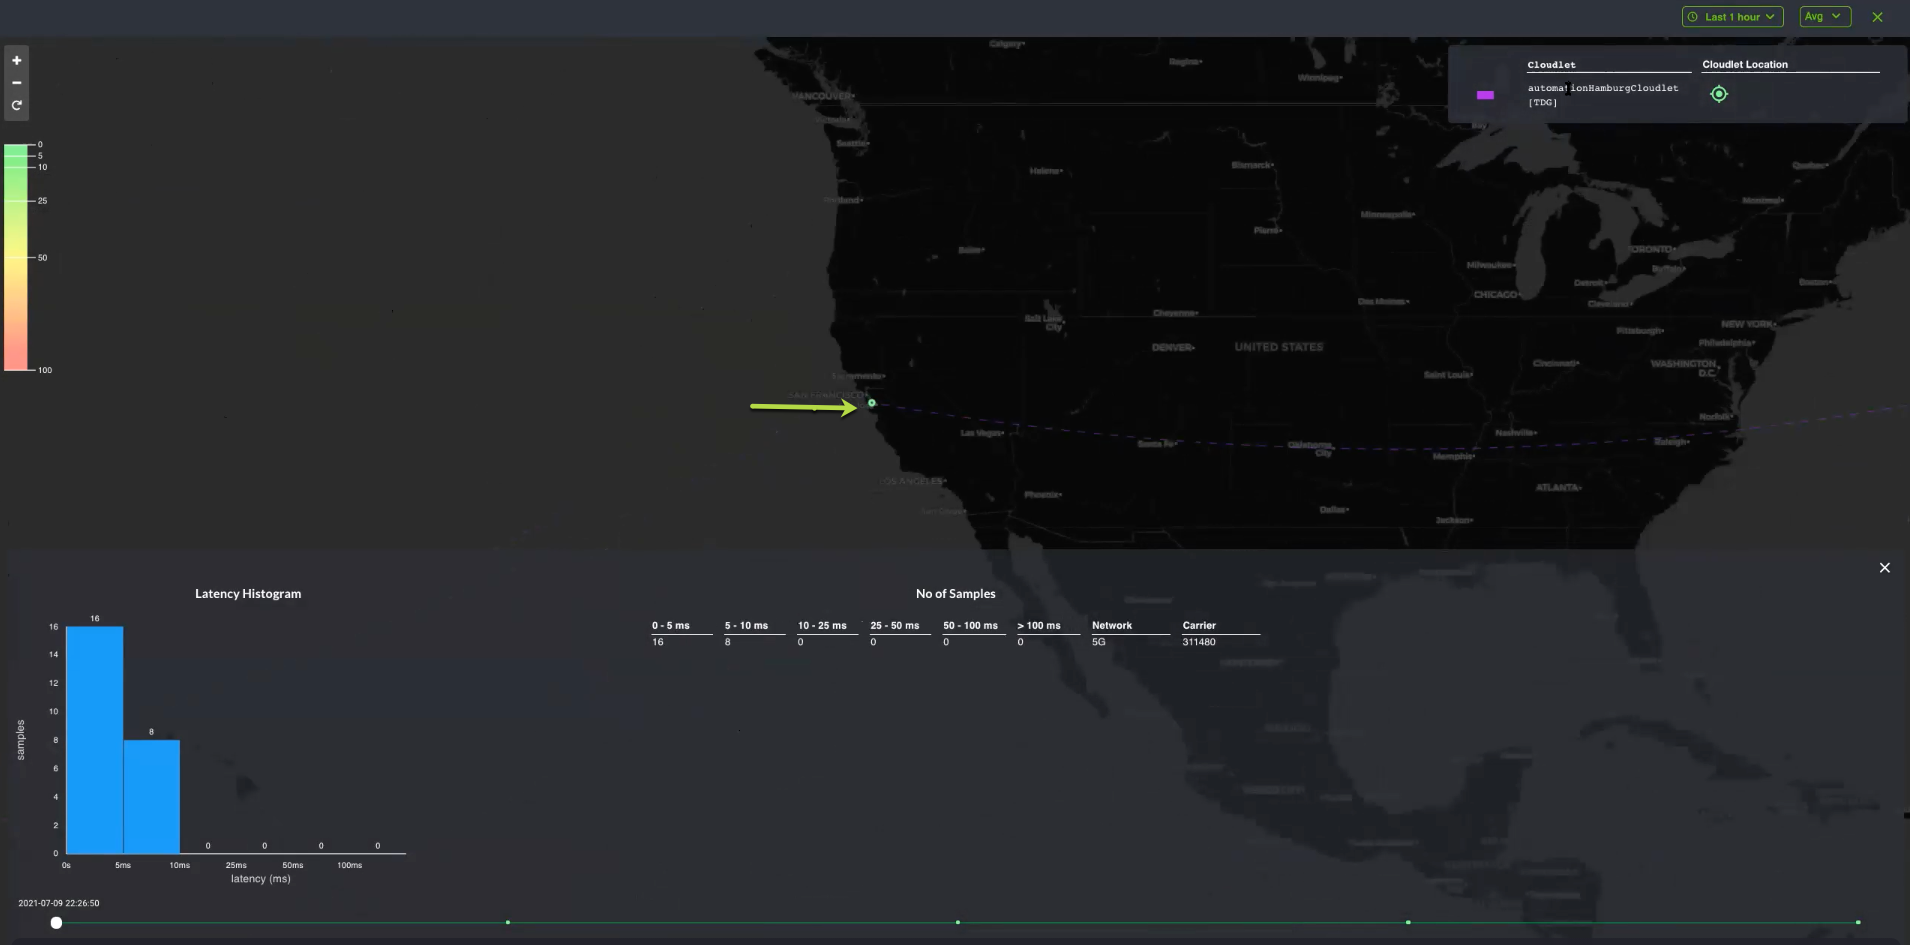
The example above shows the location in green, which takes the average of the latency aggregated for all cloudlets within that particular location and records that under No. of Sample.
As you slide the timer slider at the bottom, which monitors latency and performance degradation over time, the aggregate latency data may change based on the timeline, where each dot on the timer slider represents the latency, which is time-based and captures the average latency.
Performance is considered optimal when the Location tile is green, along with the Cloudlet Location tile, and falls under 0-5 or 5-10 milliseconds. Latency falling under 10-25ms and 25-50ms will be yellow, while 50-100ms and greater is red, indicating performance degradation.
Viewing Developer metrics
As mentioned earlier, you can view Developer metrics as long as they are part of your Cloudlet Pool. When you first log into the Edge-Cloud Console, your default view does not include Developer metrics. However, once you invited your Developer to join your Cloudlet Pool and they have accepted the invitation, the default view will change to include Developer metrics. Please note that you may need to refresh your Monitoring Dashboard.
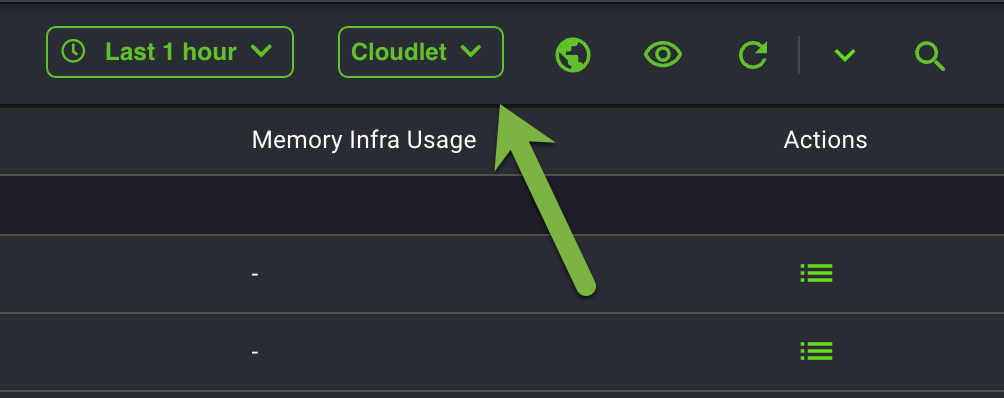
To view the different types of Developer metrics, navigate to the Cloudlet drop-down option and select App Inst, Cluster Inst, or Cloudlet, as shown below.
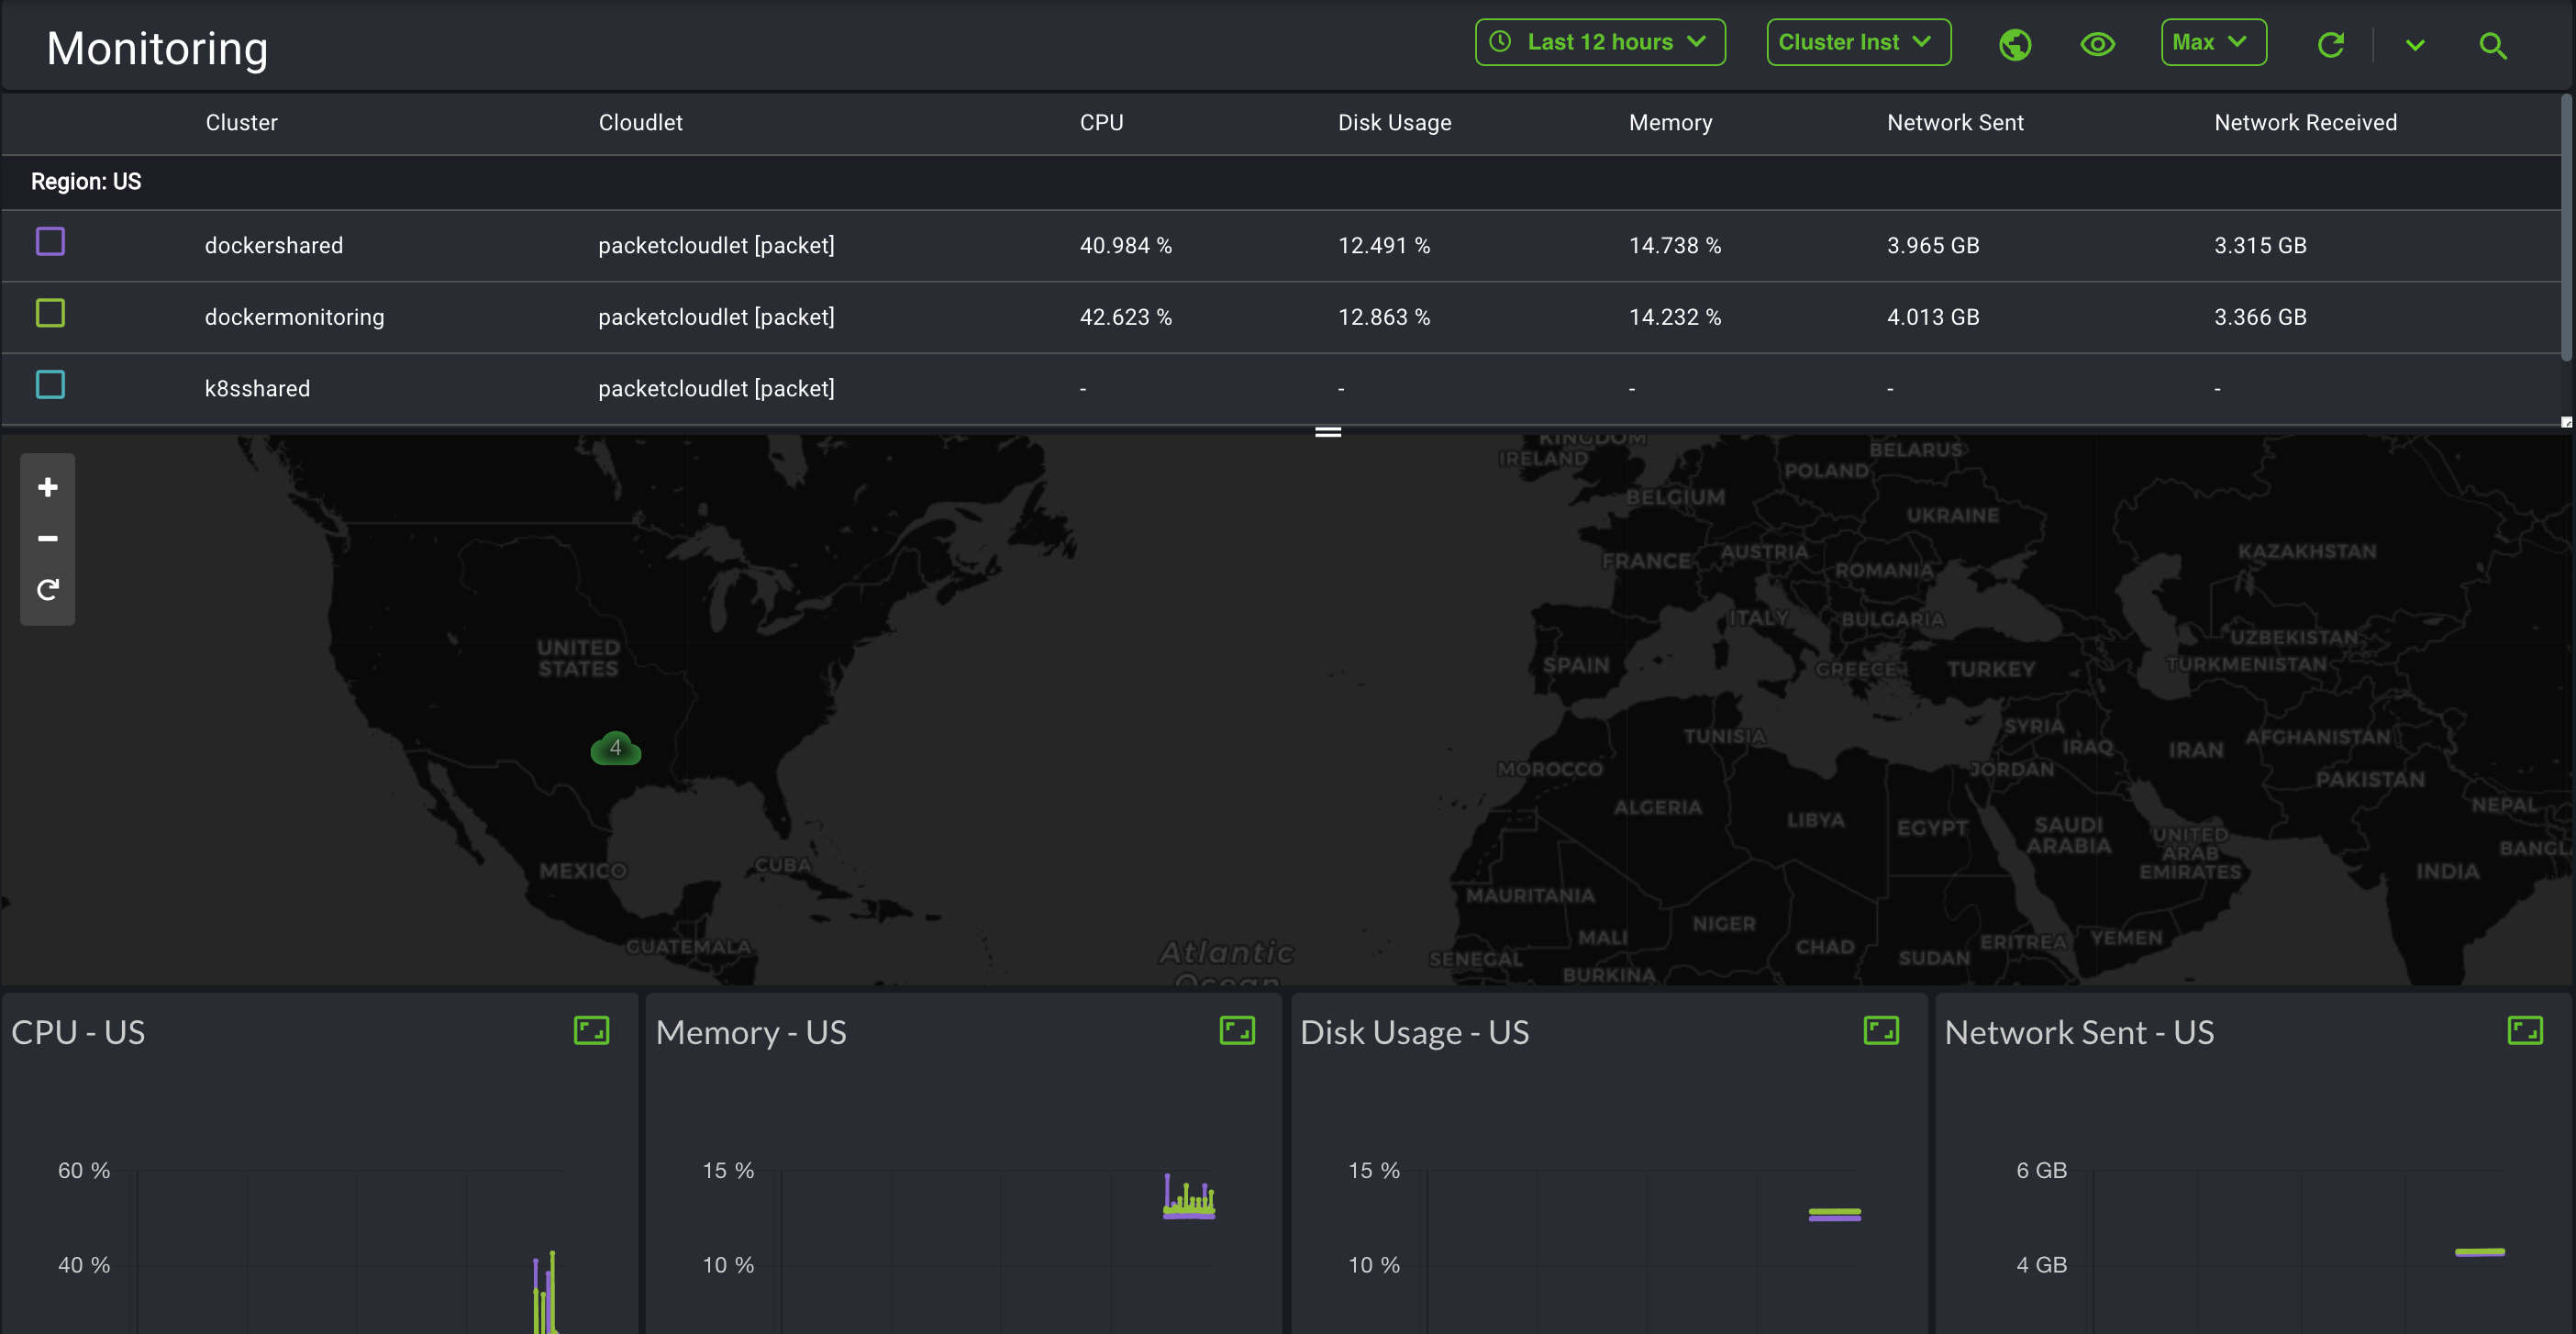
Depending on your selection, the Monitoring Dashboard will display Developer metrics specific to what you selected from the options provided.
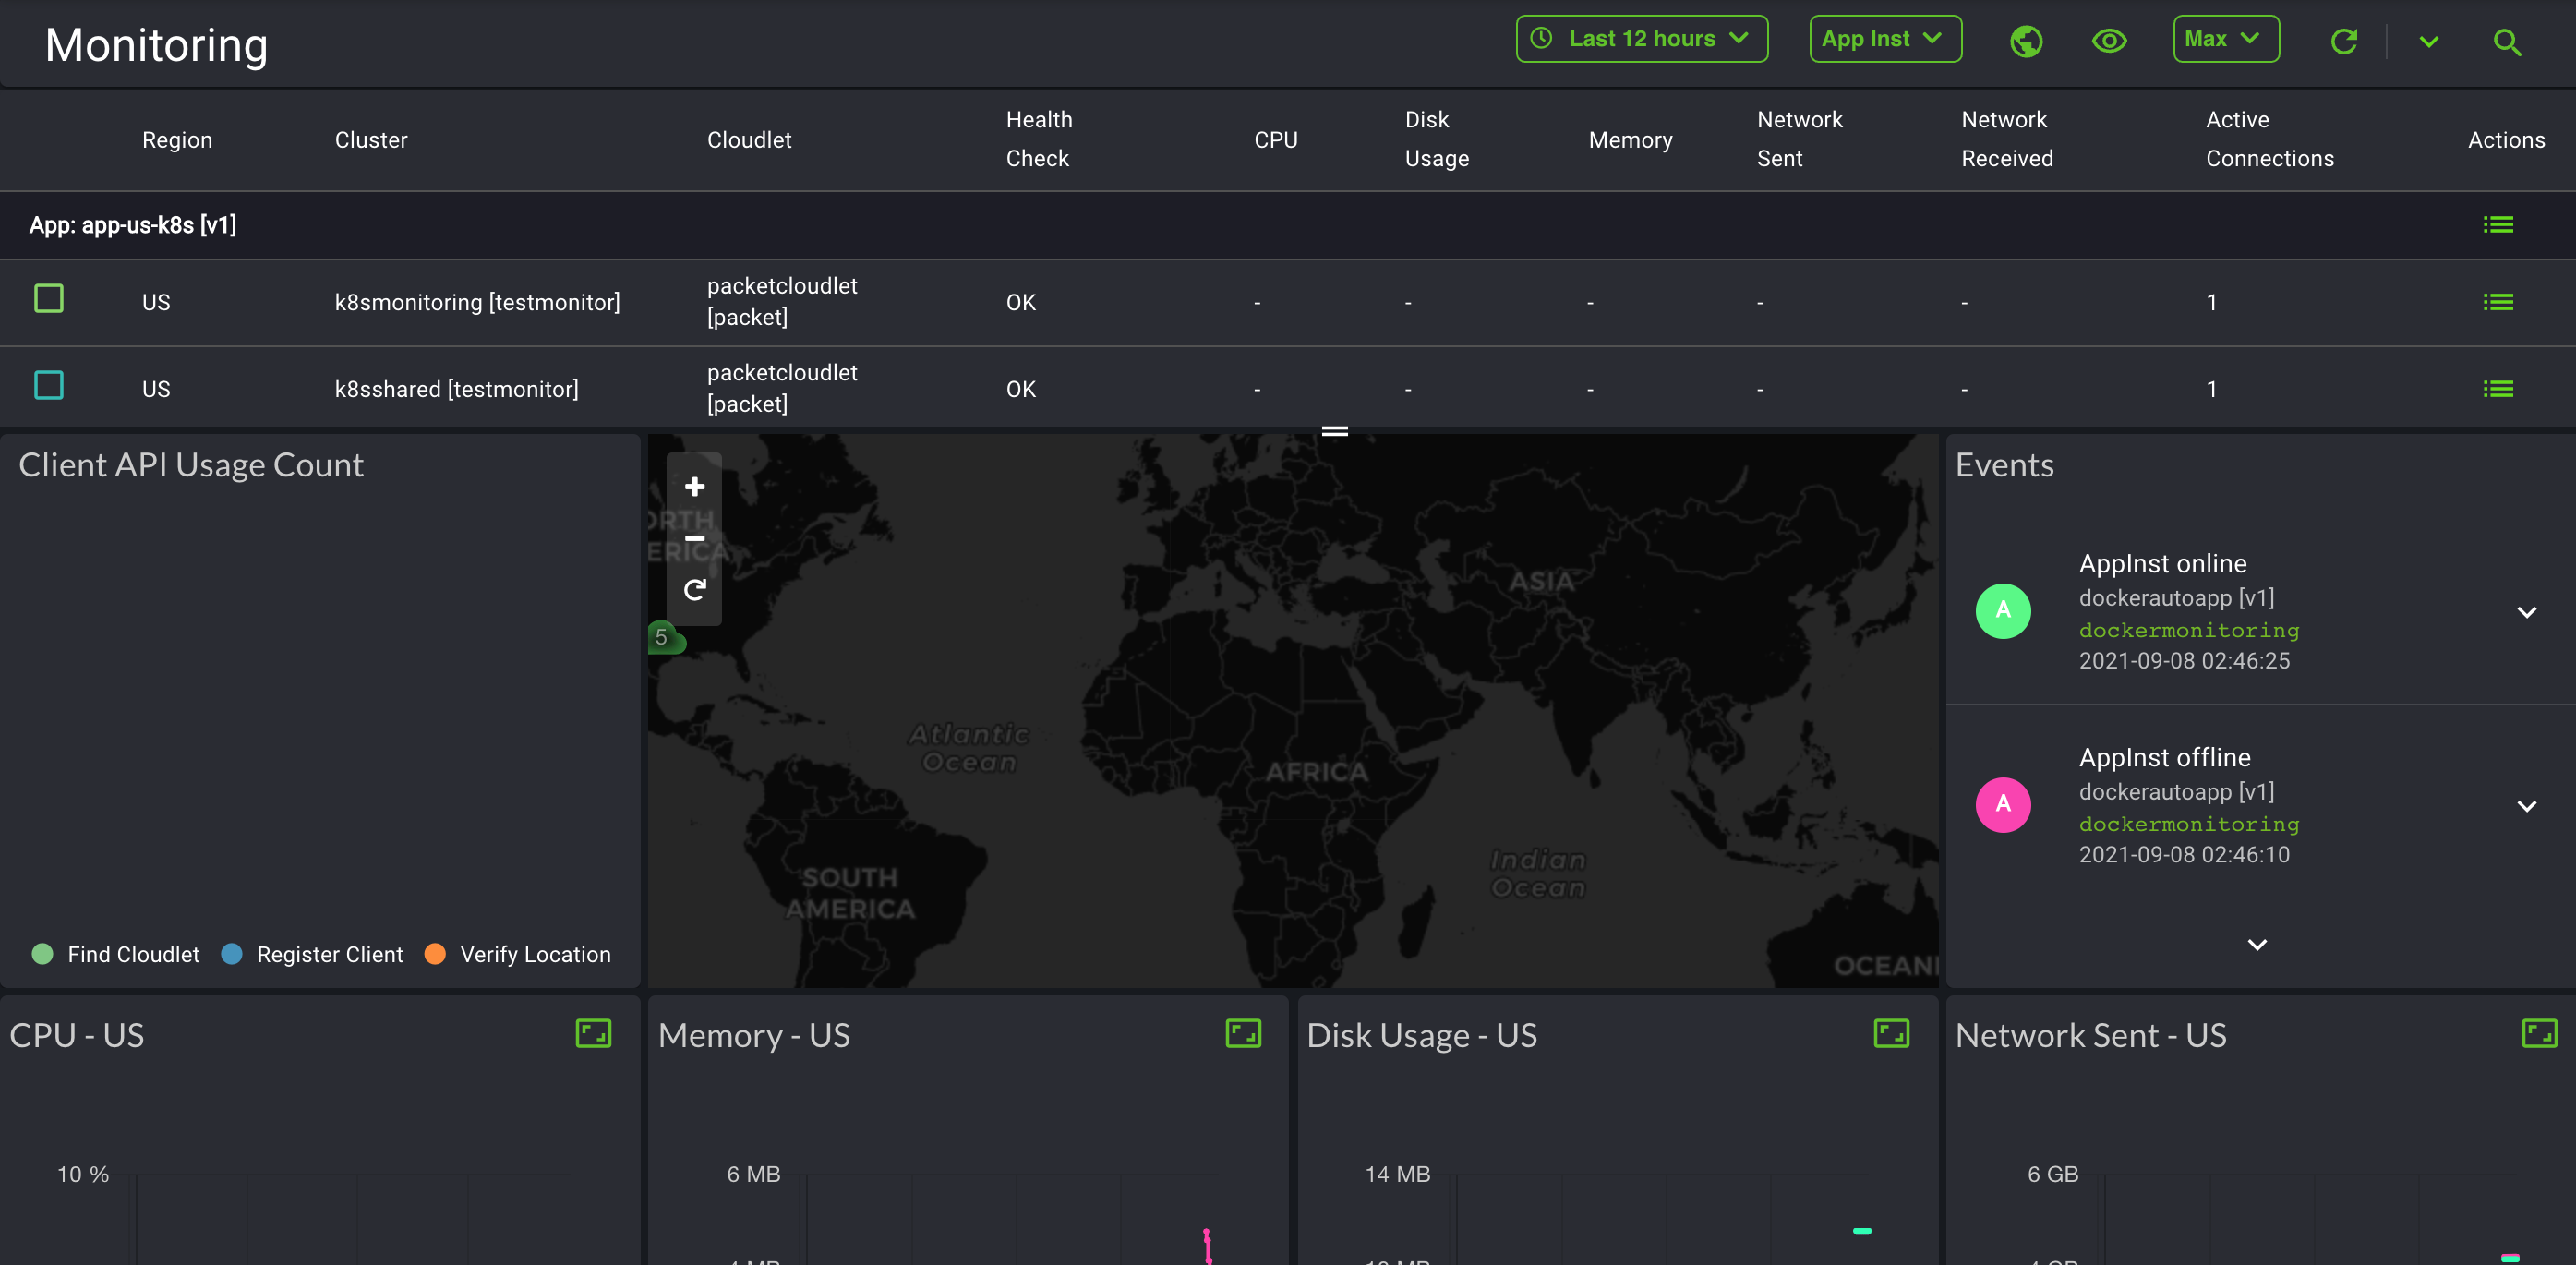
Client cloudlet usage metrics
Metric | Measurement Unit | Measurement Detail |
Latency | milliseconds | Returns min/max/avg. values |
Device info | Returns the number of sessions |
Client app usage metrics
Metric | Measurement Unit | Measurement Detail |
Latency | milliseconds |
|
Device info | DeviceInfoDynamic-Info on dynamic devices |