Health Check and Alerts
Health Checks
You can automate Health Checks on EdgeXR’s platform or configure it manually. For example, you can configure a Health Check so that it does not run for app instances. Health Checks verify the performance of a specific component, and where possible, verify the module is functioning within the designated normal tolerances.
Health Checks and QoS checks are built into EdgeXR’s platform. Once the results of the Health Checks are available, the EdgeXR team is notified and can take appropriate actions to address any errors or warning conditions detected by the Health Checks.
For example, periodic tests are performed between the EdgeXR Global Controller and the regional controllers and cloudlets. These tests can confirm that the cloudlets and controllers are active and responding. Additionally, the latency between these components is recorded and monitored for performance.
Alerts generated by the Health Checks are treated the same as any other alert; they can be sent to any defined alert receivers provided that the RBAC security is satisfied. Managing alerts this way allows operators to receive notifications of possible up-stack issues that could potentially affect their cloudlet(s).
Alerts
Alerts are generated when criteria that the user defines are met. Alerts enable you to monitor the performance and counteract irregularities within the system, helping you proactively mitigate any performance or functional issues. A notification is sent either through Slack, PagerDuty, or email, depending on the preferred delivery method configured by the user. When the issue or condition is resolved, an additional notification is sent to the user indicating that the issue has been fixed.
Some alerts depend on Health Checks which the user on the EdgeXR Edge-Cloud Console can enable. See below for examples of Alerts.
Supported alerts
Cloudlet is offline
Resource limitations have exceeded
Severity levels
Alert subscriptions can be filtered based on a severity level. Currently, you can select one of three severity levels.
Info: Normal operational messages that require no action.
Warning: May indicate that an error will occur if action is not taken.
Error: Error conditions.
AlertManager
The AlertManager is a global component of EdgeXR’s product and is responsible for distributing alerts to cloud operators. Alerts are consolidated at the regional level, where each regional controller receives alerts via a notification.
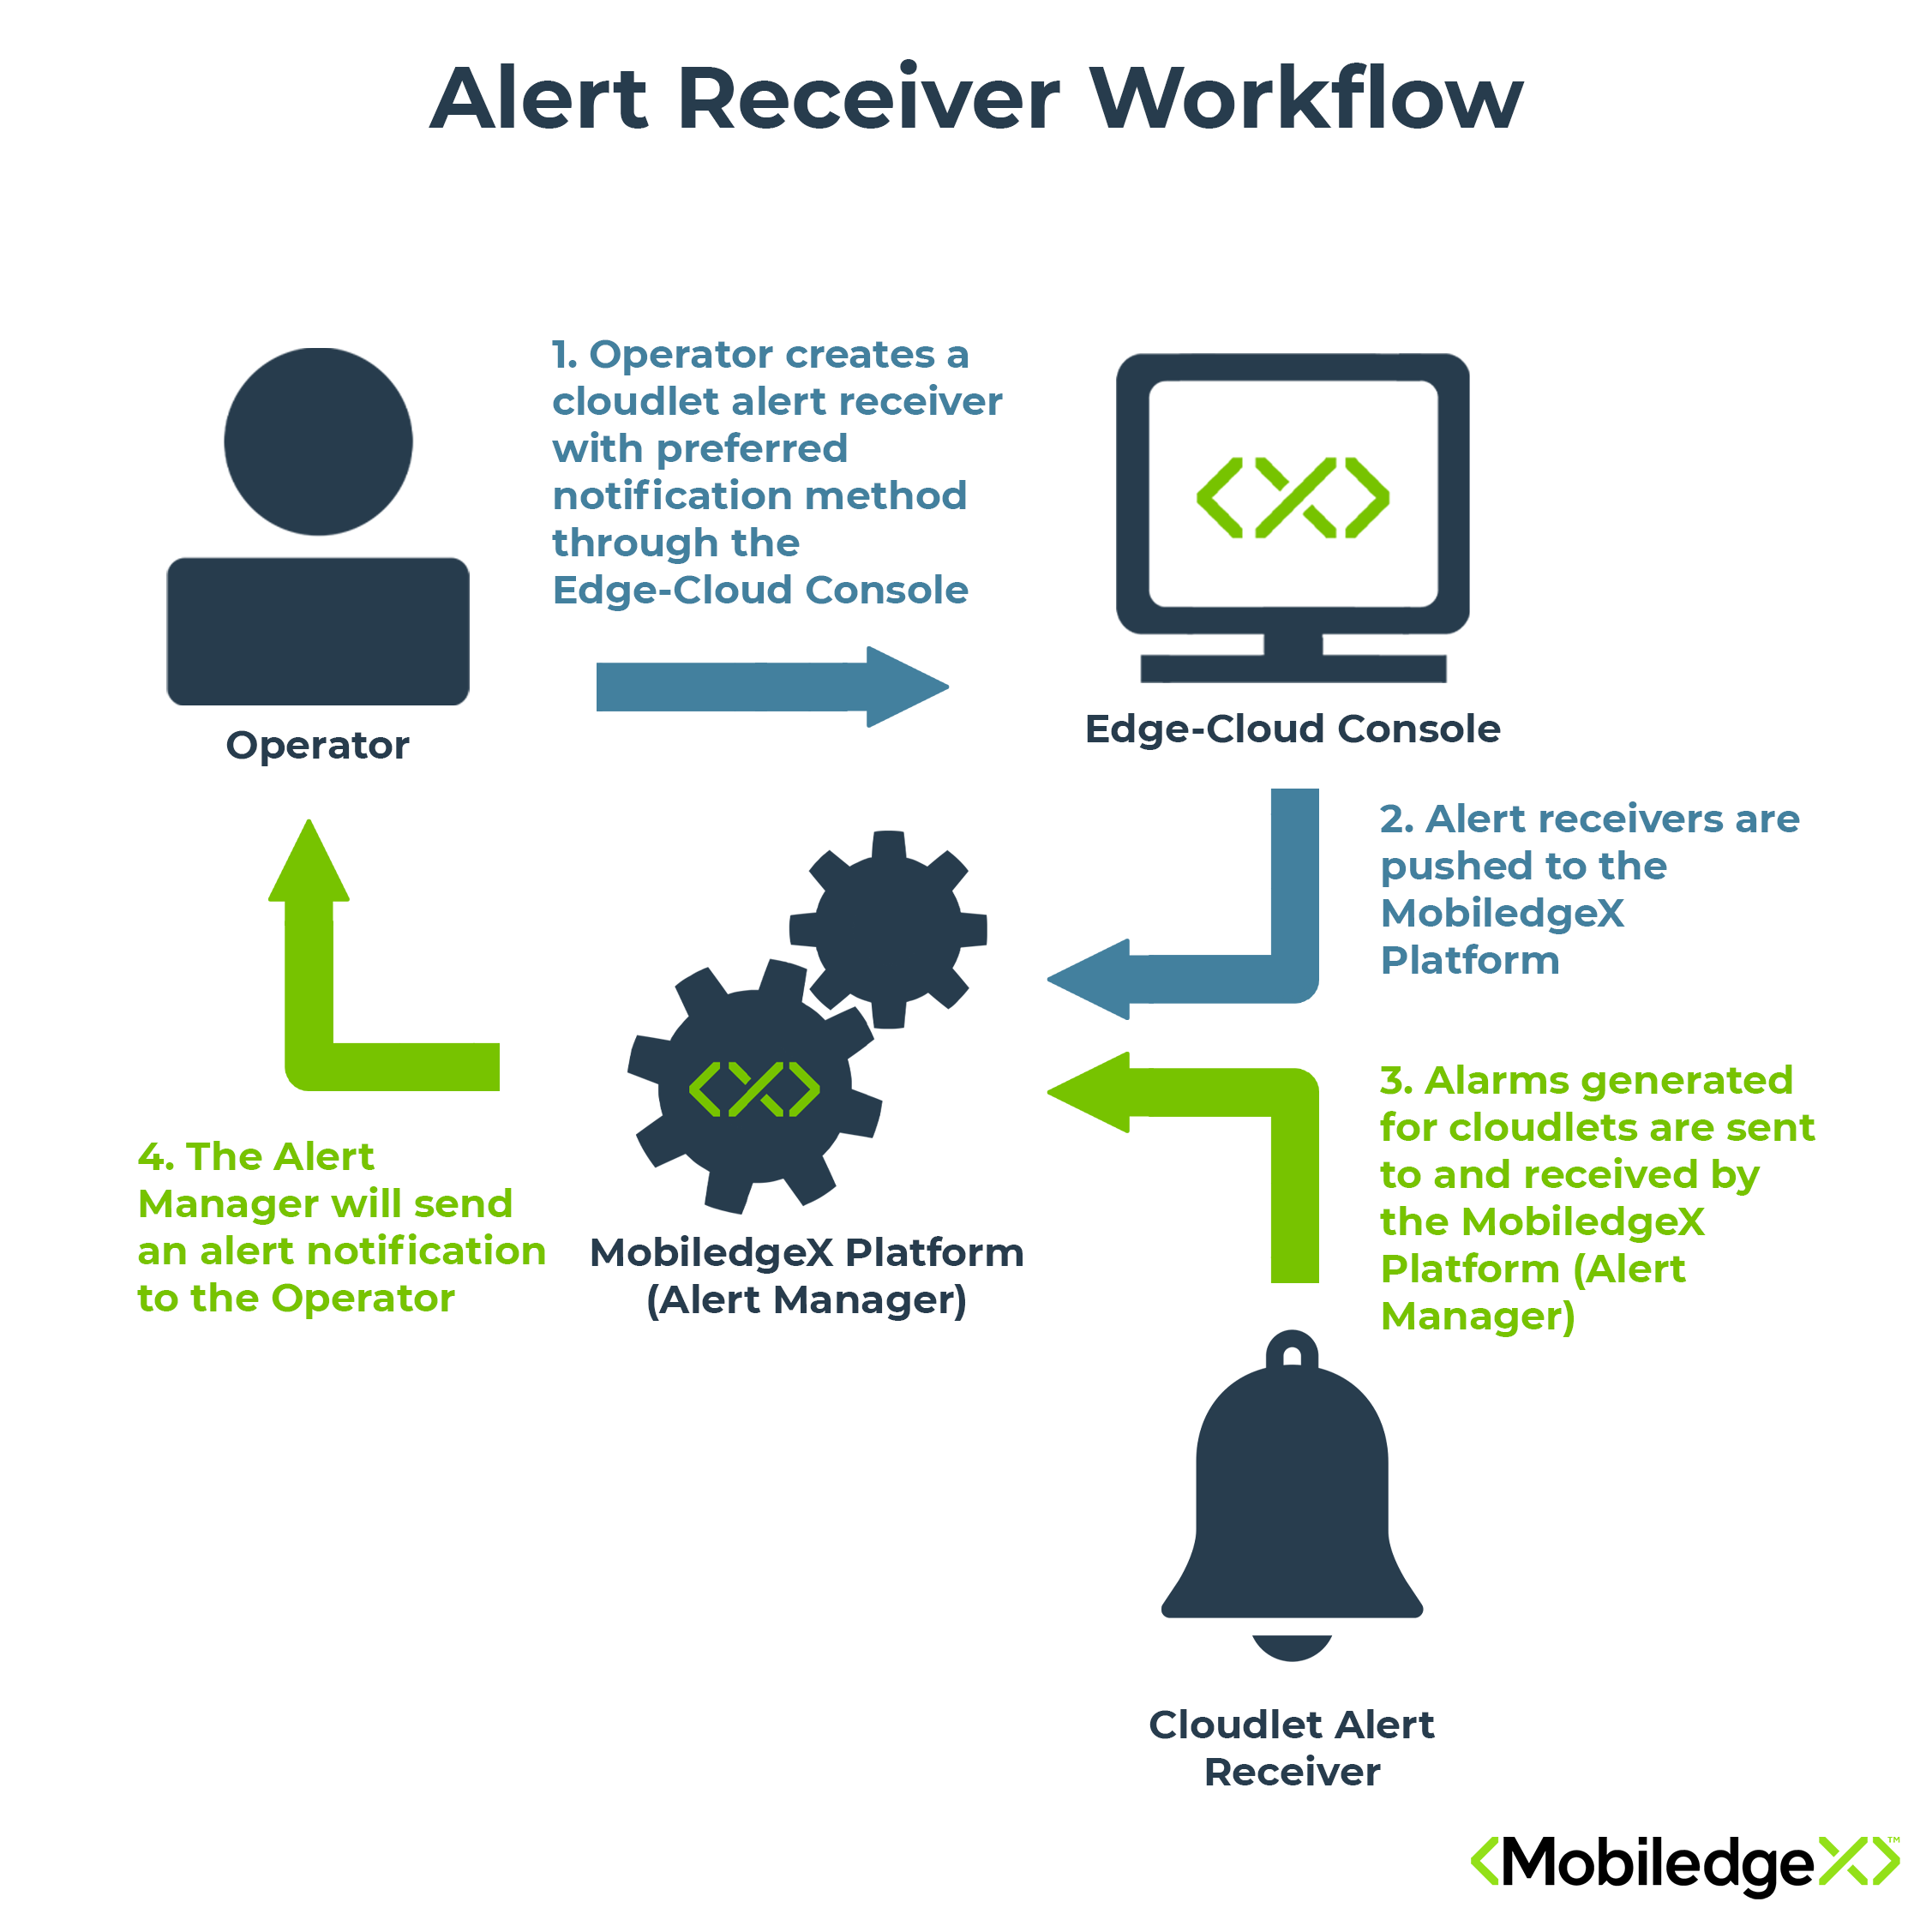
The image below illustrates the AlertManager workflow. A cloud operator can create an alert receiver and set up their preferred notification method through the Edge-Cloud Console. Once an alert receiver is created, the receiver is pushed to the EdgeXR platform. When an alarm is triggered, the Alert Manager from within the platform sends an alert notification to the cloud operator for mitigation.

Alert management
The EdgeXR platform provides a flexible alerting interface that includes the following:
RBAC support for users, roles, and organizations that control access to alerts. Any user having the ability to view a resource [that generates an alert] can create or delete an alert receiver for the resource. However, since alerts are raised and cleared by the platform, users cannot create custom alerts.
Flexibility to manage the delivery of alerts to different “alert receivers” based on user configuration. We currently support the delivery of alerts to your Slack or email account.
AlertManager and EdgeXR APIs
The AlertManager is designed to be configurable via the EdgeXR APIs, both directly and through the mcctl utility program, providing flexibility for users integrating with their existing monitoring systems.
Action | API Route |
Create an Alert Receiver |
|
Delete an Alert Receiver |
|
Show all Alert Receivers |
|
For detailed AlertReceiver API examples, please refer to the mcctl Utility Reference guide.
Set up alert receivers and notification methods through the console
While you can use the mcctl tool and the commands provided to set up your alerts and notification preferences, we recommend using the Edge-Cloud Console to set up your alert receivers for ease of use.
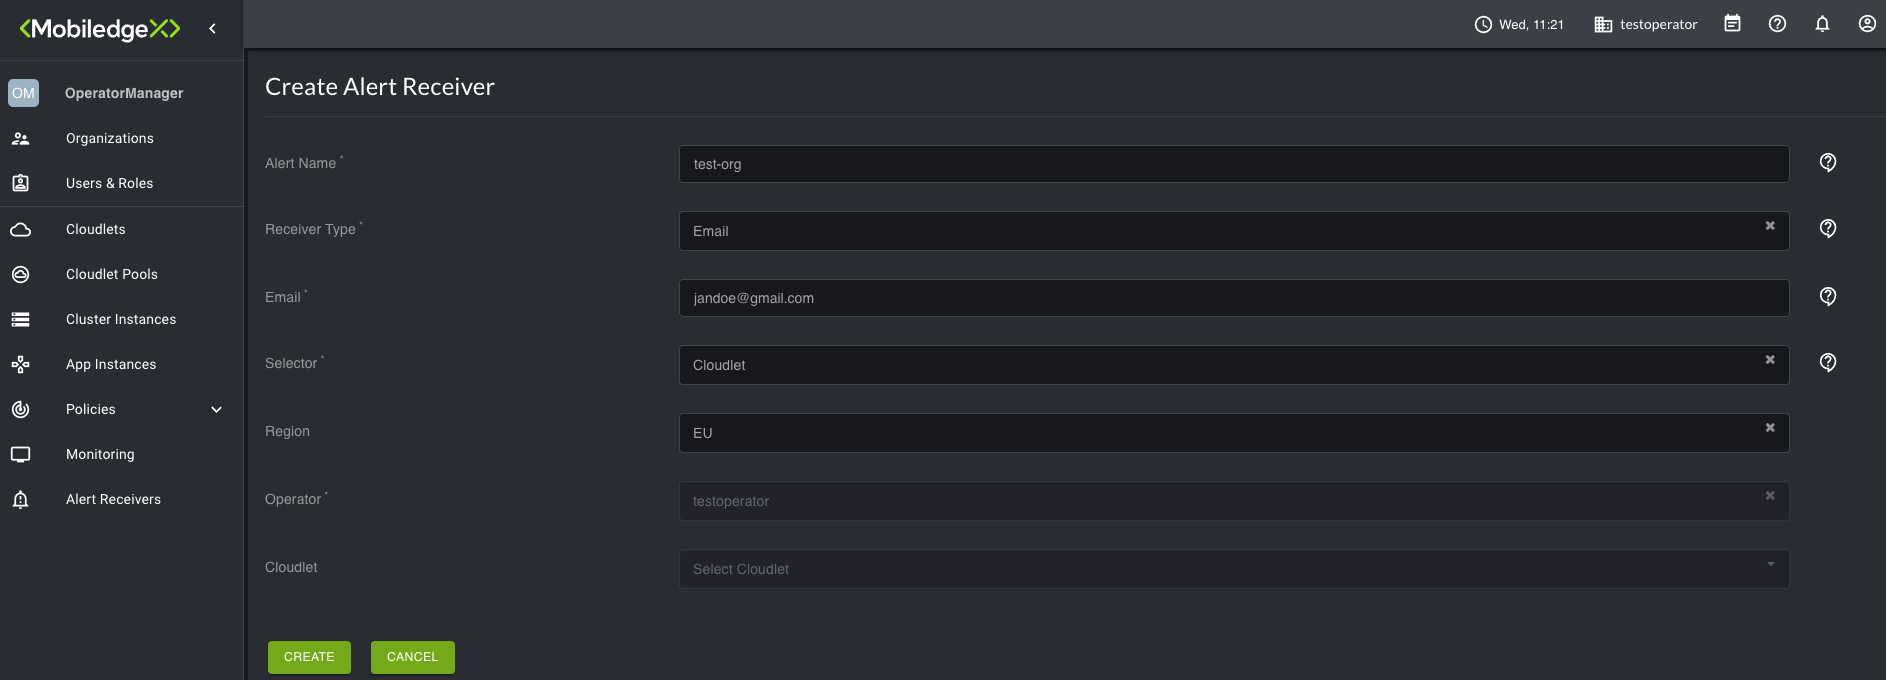
From the left navigation, select Alert Receivers, which will bring you to the Alert Receivers page.
Select the plus icon in the top right to open the Create Receiver page.
Additional fields appear depending on your selections. Populate all the required fields, then select Create.
Your new Alert Receiver will appear on the Alert Receivers page. When you select the Alert icon, information about the alert is displayed.

Resolving alerts
The alert is considered resolved when the condition that triggered the alert has not been active for a period of time. For example, if the Health Check probe is no longer failing to reach the application, AppInstDown, the alert will get resolved, and a notification about the resolution will be sent to the user using a configured alert receiver.
View Audit Logs
Historical activities performed by you and others within your organization are logged and viewed from the Edge-Cloud Console. These logs are used for diagnostic purposes or error correction, and each activity is logged by date and time. You can trace different events through the various sub-sections, separated into three parts: Raw Viewer, Request, and Response. These sections provide valuable information if you require support from EdgeXR. Copy and paste the traceid from the Raw Viewer section, and email the traceid to [email protected].
To view the audit logs, from the Organizations page, under the Actions menu, select Audit.
You may be performed on this page:
Filter logs by region
Filter logs by time range
Contact Support
You can email [email protected] to assist you in resolving product issues. To help expedite your request, make sure you copy and paste the traceid, which can be found on the Audit logs page, into your email with a brief description of your issue.